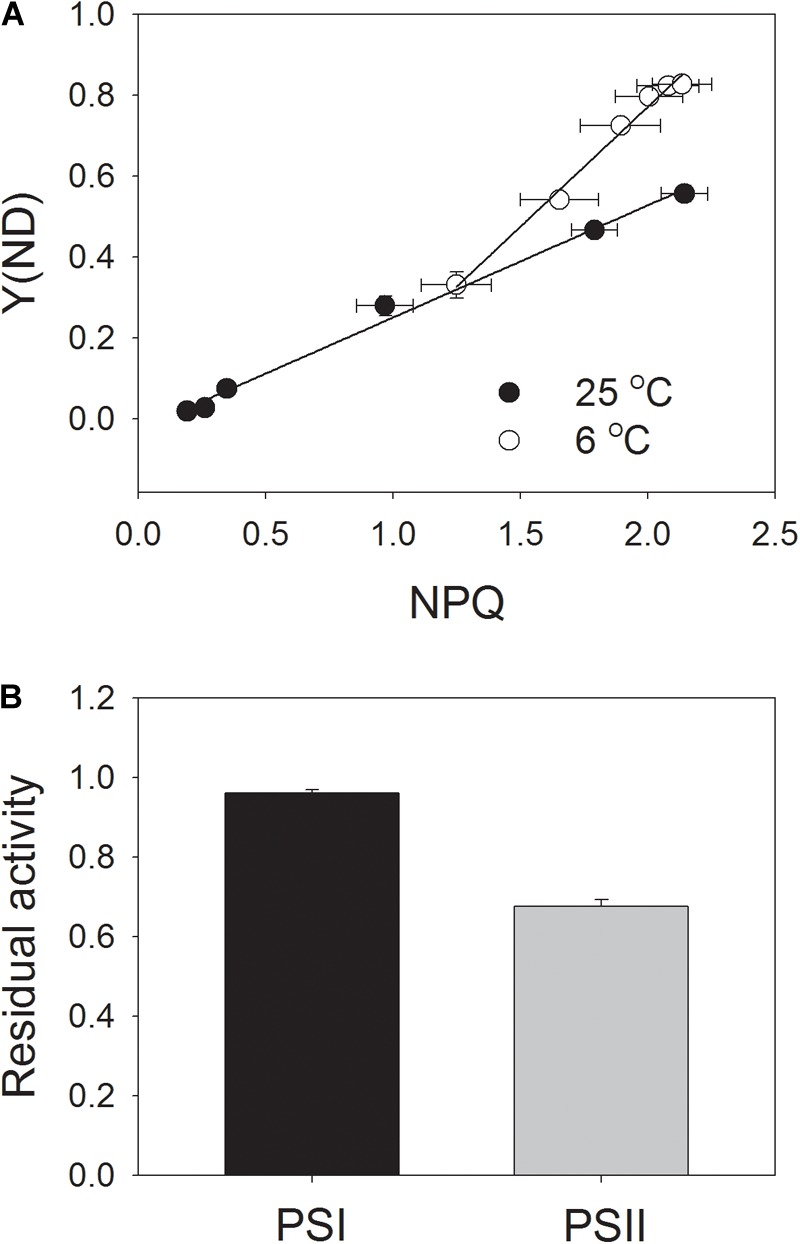
FIGURE 6.

Correlation between NPQ and Y(ND) (A) and residual activity of PSI and PSII (B) after exposure to 1178 μmol photons m-2 s-1 at 6°C for 100 min. Data of Figures 4B, 5B were used to analyze the correlation between NPQ and Y(ND). After the chilling-light treatment, the Pm (maximum photo-oxidizable P700 content) and Fv/Fm were measured, and the data were normalized to Pm and Fv/Fm before treatment and are represented as the residual activity of PSII and PSI after chilling-light treatment. Values are means ± SE (n = 4).
