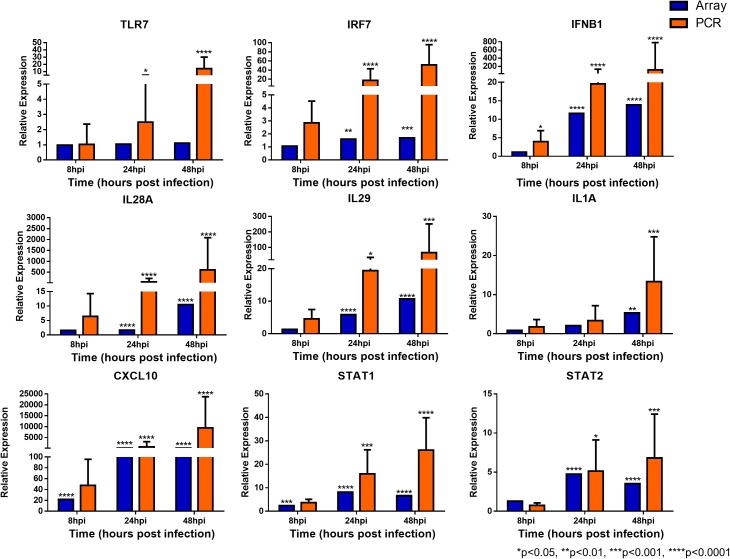
FIGURE 5.
Expression of immune response genes in nasal epithelial cells following influenza infection. Expression of host genes in response to influenza in sequence: TLR7, IRF7, IFNB1, IL28A, IL29, IL1A, CXCL10, STAT1, and STAT2 (n = 4–12). The statistical significance level of the RT-qPCR expression was calculated using one-way ANOVA, nonparametric, grouped, Dunn multiple comparison test, with the p-value derived by comparison against uninfected control cells. ∗p < 0.05; ∗∗p < 0.01; ∗∗∗p < 0.001; ∗∗∗∗p < 0.0001. The RT-qPCR data were presented as medians with inter-quartile range.

