Figure 1.
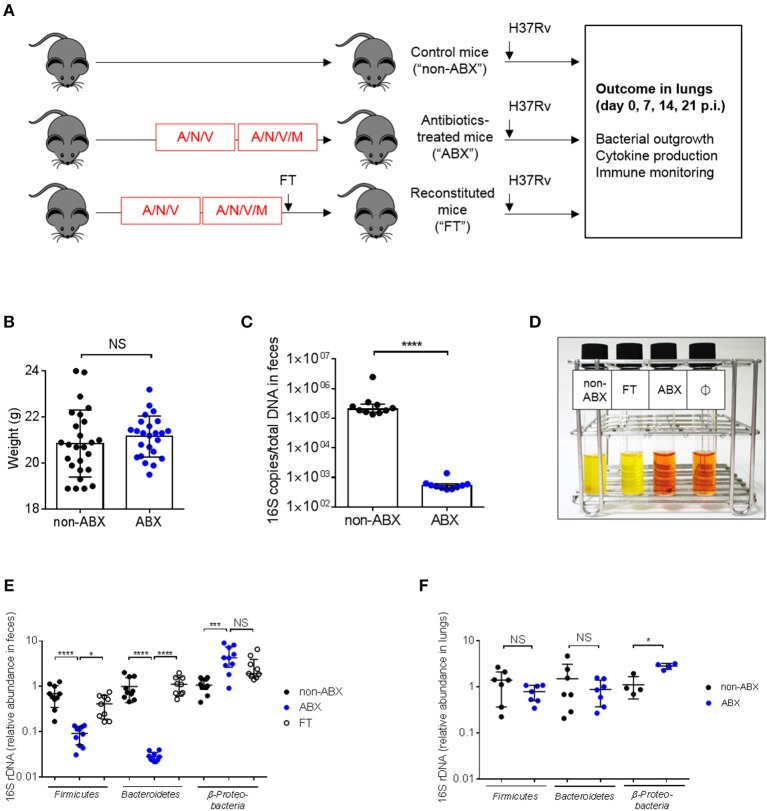
Mouse model to study the impact of microbiota dysbiosis during M. tuberculosis infection. (A) Experimental design. Six-to-eight weeks old C57BL/6 female mice were treated for 4 weeks with a cocktail of broad-spectrum antibiotics (ampicillin, A, neomycin sulfate, N, vancomycin, V, and metronidazole, M, which was added during the last 2 weeks) in drinking water (ABX) or were given water without antibiotics (non-ABX). Microbiota reconstitution was realized through fecal transplantation (FT) after a single oral gavage with the intestinal content from 2 control mice and occurred during 1 week. The three groups of mice received an intranasal challenge of M. tuberculosis H37Rv (103 CFUs/mouse). Bacterial outgrowth, cytokine production and immune monitoring were determined 0, 7, 14, or 21 days post-infection (p.i.) in the lungs. (B) Mouse weight in the ABX vs. non-ABX groups at the time of M. tuberculosis infection. Data from 4 independent experiments (n = 4–14 mice/group/experiment) were pooled and the graph represent mean ± SD of the pooled data. Data were analyzed using the unpaired Student's t-test. (C) The amount of bacterial rDNA was assessed using the “Universal 16S RT-qPCR” kit, calculated as 16S rDNA gene copies per total DNA extracted from feces of non-ABX and ABX groups before infection. (D) Colorimetric evaluation of the presence of microbial flora in the feces of the different groups of animals before infection; Ø indicates negative control. Yellow color indicates the presence of live microorganisms. Image depicted in (D) is representative of 3 independent experiments. Fecal (E) and lung (F) microbiota were detected by RT-qPCR using phylum-specific primers. Relative Ct value compared to universal 16S rRNA gene Ct value (ΔCt) and the mean of ΔCt values in the control group (ΔΔCt). (E, F) data from 2–3 independent experiments (n = 2–4 mice/group/experiment) were pooled. The graph (E) show mean ± SD (Firmicutes and Bacteroidetes) and median with interquartile range (Proteobacteria) of the pooled data. Data were analyzed using ANOVA (Firmicutes and Bacteroidetes) and the Kruskal-Wallis test (Proteobacteria). The graph (F) show median with interquartile range of the pooled data. Data were analyzed using the Mann-Whitney test. NS, not significant; *p < 0.05; ***p < 0.001; ****p < 0.0001.

