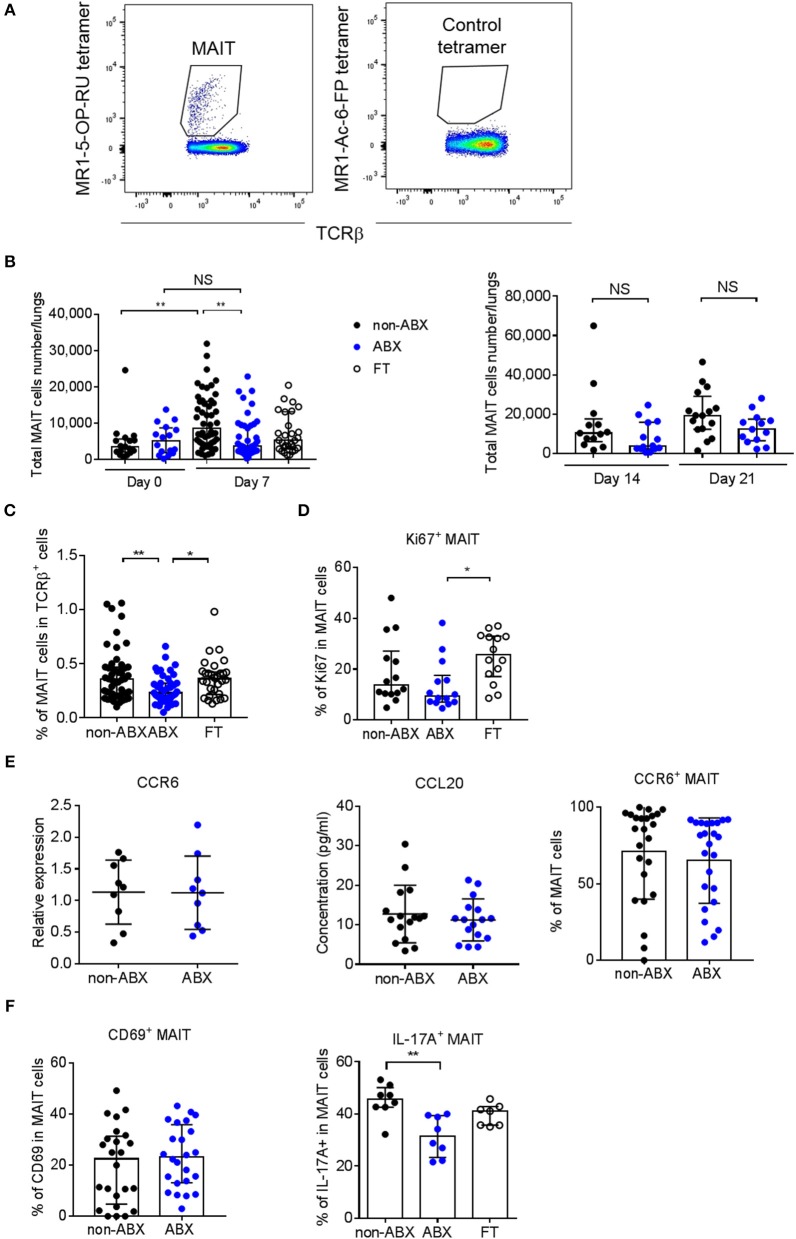
Figure 4.
MAIT cell accumulation in the lungs and IL-17A-production are decreased early after M. tuberculosis infection in microbiota-altered mice. (A) Gating strategy to analyze MAIT cells (MR1-5-OP-RU tetramer+TCRβ+) by flow cytometry. A MR1–Ac-6-FP tetramer+TCRβ+ staining was used as a control. (B,C) Total number (B) and percentage (C) of MAIT cells in the lungs of control (non-ABX) ABX, and FT mice 0 and 7 (B, left panel), 14 and 21 (B, right panel), and 7 (C) days p.i., Data from 2–6 independent experiments (n = 4–8 mice/group/experiment) were pooled and the graphs show median with interquartile range of the pooled data. Data were analyzed using the Kruskal-Wallis test. (D) Intracellular analysis of Ki67 expression in MAIT cells from non-ABX, ABX, and FT mice 7 days p.i., by flow cytometry. Data from 2 independent experiments (n = 4–8 mice/group/experiment) were pooled and the graphs show the median with interquartile range of the pooled data. Data were analyzed using the Kruskal-Wallis test. (E) The expression of CCR6 (left) in whole lung homogenates or in MAIT cells (right), and the production of CCL20 in lung supernatant (middle), were measured by RT-qPCR (left), flow cytometry (right) and ELISA (middle) in ABX and control (non-ABX) mice 7 days p.i., RT-qPCR data were analyzed as in Supplementary Figure 2. Data from 3 (left) or 4 (middle and right) independent experiments (n = 3–7 mice/group/experiment) were pooled and the graphs show mean ± SD of the pooled data. Data were analyzed using the Student's t-test. (F) Cytometry analysis of percentage of activated (MR1-5-OP-RU tetramer+TCRβ+CD69+) MAIT cells (left), and IL-17A-producing (MR1-5-OP-RU tetramer+TCRβ+IL-17A+) MAIT cells (right) in lungs of control (non-ABX), ABX and FT mice 7 days p.i., Data from 4 (left) or 1 representative of 3 (right) independent experiments (n = 5–8 mice/group/experiment) were pooled and the graphs show mean ± SD of the pooled data. (left) or median with interquartile range (right) of the pooled data. Data were analyzed using the unpaired Student's t-test (left) or the Kruskal-Wallis test (right). NS, not significant; *p < 0.05; **p < 0.01.

