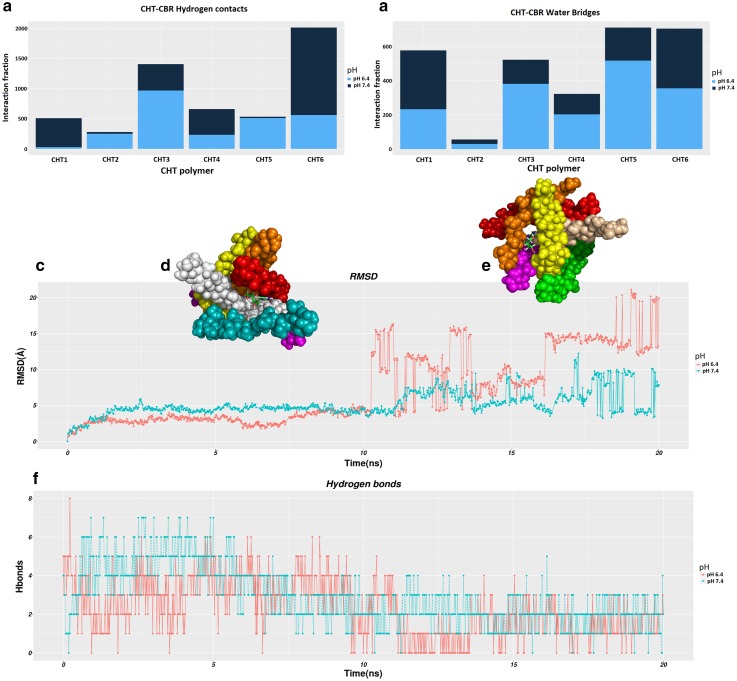
Fig. 1.
Molecular dynamic simulations of CBR–CHT polymer interaction across a timescale of 20 ns. a Histogram of average number of hydrogen bonds; b water bridges between one molecule of CBR and six CHT monomeric units, at pH6.4(dark blue) and pH 7.4 (light blue); c RMSD of the Cα atom of CBR molecule from initial coordinates as a function of simulation time; d Overlaid on RMSD plot the snapshot of CBR release during 10.2 ns at pH 6.4; e Overlaid on RMSD plot the snapshot of CBR release during 17.5 ns at pH 7.4; (f) number of hydrogen bonds formed between CBR and CHT polymer vs simulation time

