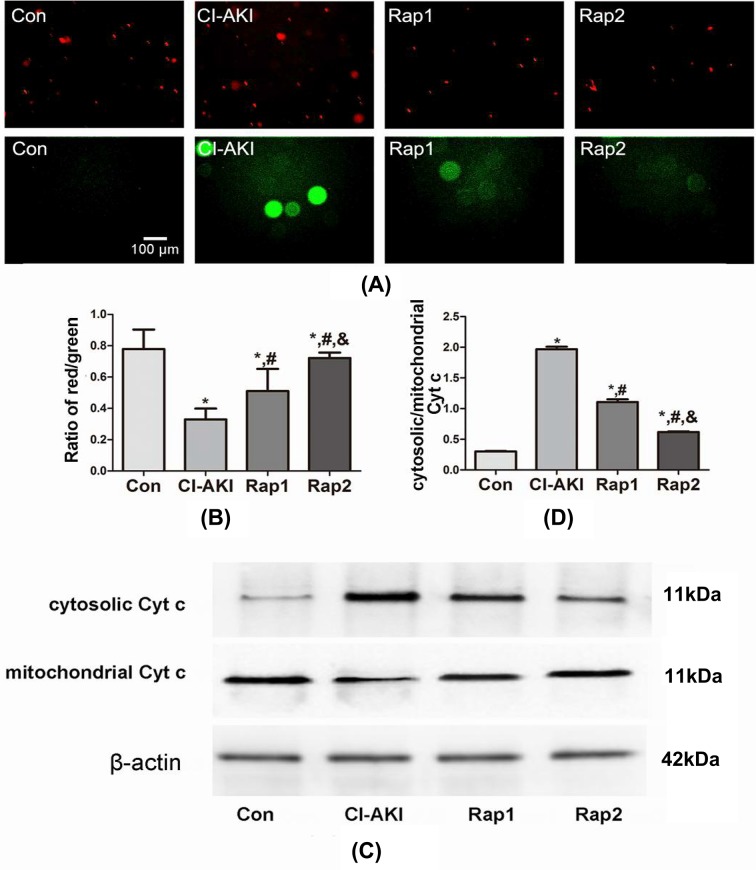
Figure 3. Changes in mitochondrial injury following contrast exposure with or without rapamycin.
(A) ΔΨm in kidneys from rats in group Con (Con), group CI-AKI (CI-AKI), group Rap1 (Rap1), and group Rap2 (Rap2) was detected by JC-1. Descriptions of the groups are in the text. Contrast exposure induced the significant decrease in ΔΨm. Rapamycin pretreatment alleviated the decline of ΔΨm. (B) Columns represent the ratio of red/green. The fluorescence intensity of red or green and the ratio of red/green were calculated and analyzed by Image-Pro Plus 6.0 software. Data show the mean ± S.D. Experiments were repeated three times. (C) The expression of Cyt c in cytoplasm and mitochondria from kidneys in group Con (Con), group CI-AKI (CI-AKI), group Rap1 (Rap1), and group Rap2 (Rap2) was measured by Western blot analysis. Descriptions of the groups are in the text. The ratio of cytosolic/mitochondrial Cyt c obviously increased following contrast exposure. Rapamycin pretreatment significantly attenuated contrast-induced the release of Cyt c from the mitochondria. (D) Columns represent the gray-scale value of Cyt c expression. Data show the mean ± S.D. Experiments were repeated three times. *P<0.05 compared with Con; #P<0.05 compared with CI-AKI; &P<0.05 compared with Rap1.

