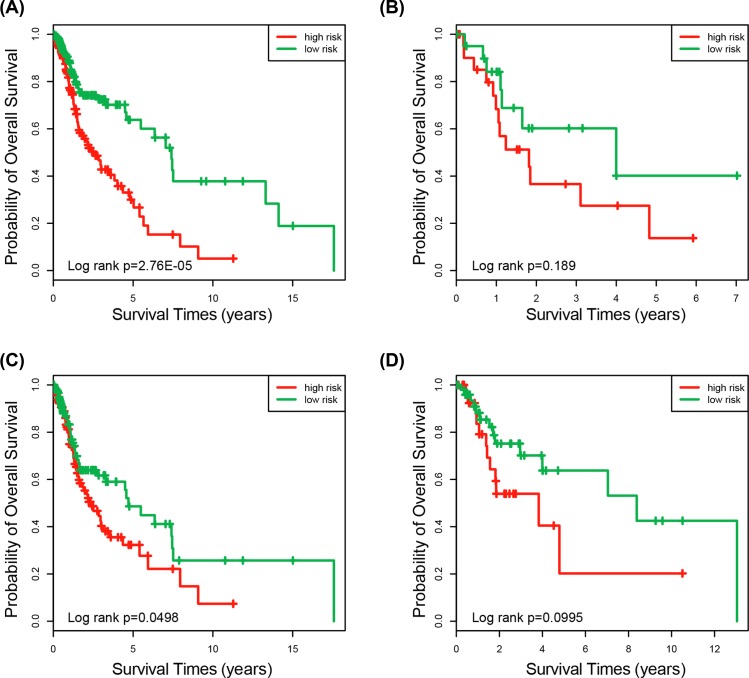
Figure 4. Survival analysis of all patients with pN and pathologic stage information.
(A) Kaplan–Meier curves for patients with positive of pN (n=339). (B) Kaplan–Meier curves for patients with negative pN (n=45). (C) Kaplan–Meier curves for patients with stage III/IV (n=273). (D) Kaplan–Meier curves for patients with stage I/II (n=86).

