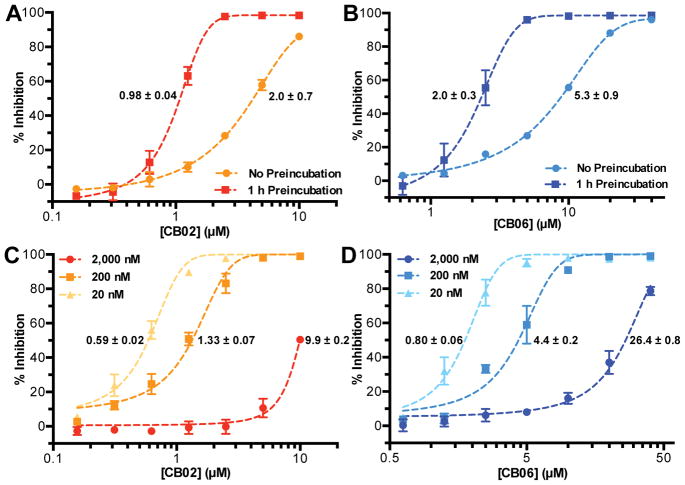
Figure 5.
(A,B) The effect of pre-incubation time on ap-parent potency. Dose-response of CB02 and CB06 comparing 1 h pre-incubation with IucA to no pre-incubation (initiating reaction with enzyme) employing the MG assay. (C,D) The effect of target enzyme (IucA) concentration on apparent potency. Dose-response of CB02 and CB06 with three concentrations of IucA (2 μM, 200 nM, and 20 nM) in the MG assay. Plotted is the mean of triplicate reactions ± SD fitted with non-linear regression. IC50 values (μM) ± SE are listed next to each curve.

