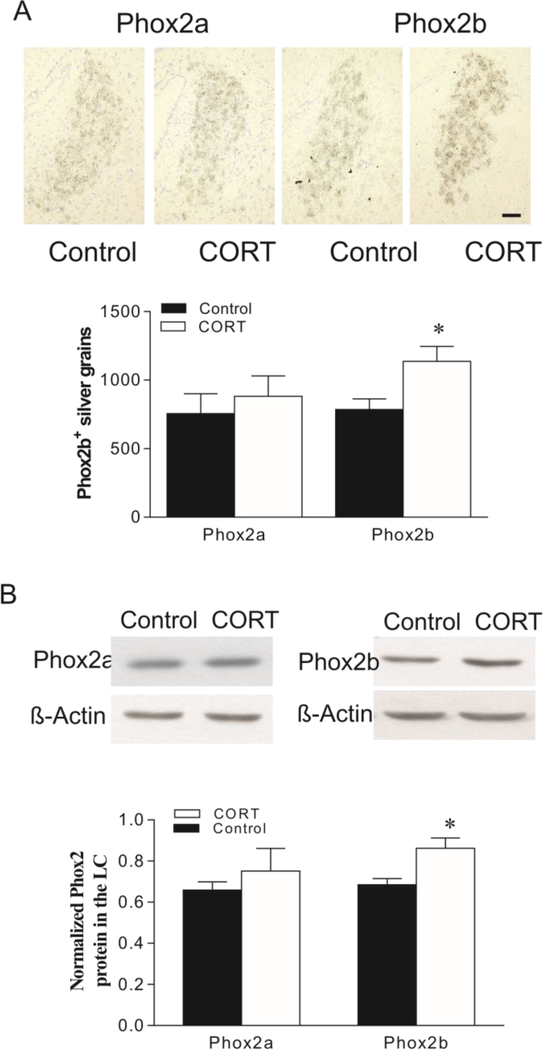
Figure 4:
Effects of oral administration of CORT on mRNAs (A) and protein (B) levels of Phox2a and Phox2b in the rat LC. Upper panel in A: Phox2a/2b mRNA in LC of rat brains detected by in situ hybridization (N=7/group). Lower panel in A: Quantitative analyses of mRNA in slides. Upper panel in B: Autoradiographs obtained by western blotting of Phox2a/2b in LC of rat brains (N=8/group). Lower panel in B: Quantitative analyses of band densities. Values of Phox2 bands were normalized to those of β-actin probed on the same blot. * p<0.05, compared to the control. Scale bar: 50 μm for all images.

