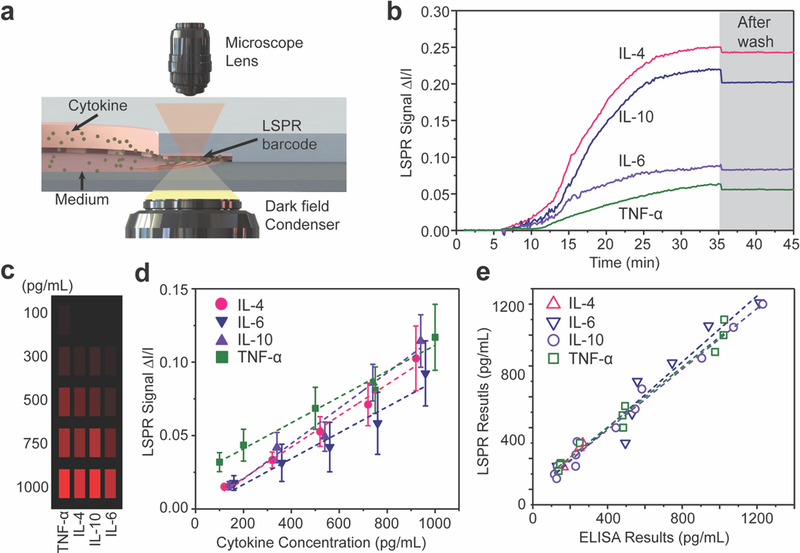
Figure 2. Label-free and multiplex nanoplasmonic measurement of cell-secreted cytokines.
(a) Schematic of LSPR signal detection on a dark-field microscopy stage. (b) Real-time LSPR signals during the multiplex cytokine detection. The gray area shows the LSPR signal after washing with PBS. (c) Mapping of intensity variations at LSPR microarray sensing spots for four different types of cytokines at different concentrations. (d) Calibration curves of purified IL-4, IL-6. IL-10, and TNF-α obtained from LSPR nanoplasmonic biosensor microarray chip. Each sample were measured ten times. Error bar: standard error. (e) Correlation between data obtained from independent LSPR microarray and gold standard ELISA experiments using the same samples.

