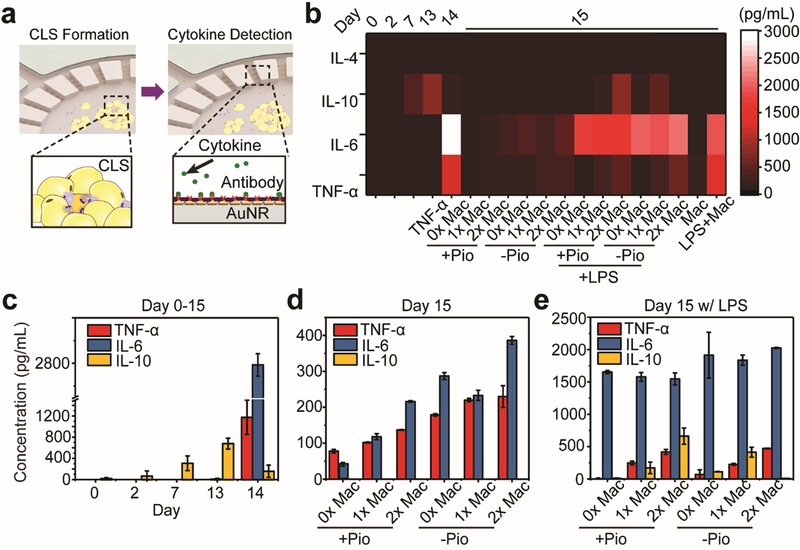
Figure 4. On-chip Multiplexed Cytokine Secretion Profile Measurement.
(a) Schematic of on-chip CLS formation and cell-secreted cytokine detection. (b) A heat map visualization representing the concentrations of IL-4, IL-6, IL-10 and TNF-α at different stages of adipose-tissue-on-chip, with different concentration of macrophages and with/without different reagents such as Pio and LPS. (c) Cytokine secretion profiles of 3T3L1 adipocytes during the 13-day differentiation process. The adipocytes exhibited an increasing trend of IL-10 before Day 13. After adding a pro-inflammatory stimulation of 2 ng/mL TNF- α, IL-10 levels were suppressed and IL-6 levels were raised significantly to high levels. (d) Comparison of cytokine secretion profiles of adipose-tissue-on-chip after adding different densities of J7 macrophages in the medium with (+Pio) or without (-Pio) pioglitazone. (e) Cytokine secretion profiles of the adipose-tissue-on-chip after pro-inflammatory LPS stimulation in the medium with (+Pio) or without (-Pio) pioglitazone. From (c)-(e) the results were measured from at least 3 samples in same condition. Error bar: Standard error.

