
Figure 3. Effects of B cell-intrinsic TRAF2 or TRAF3 deficiency on AID expression and GLT of Cγ1 or Cε induced by CD40.
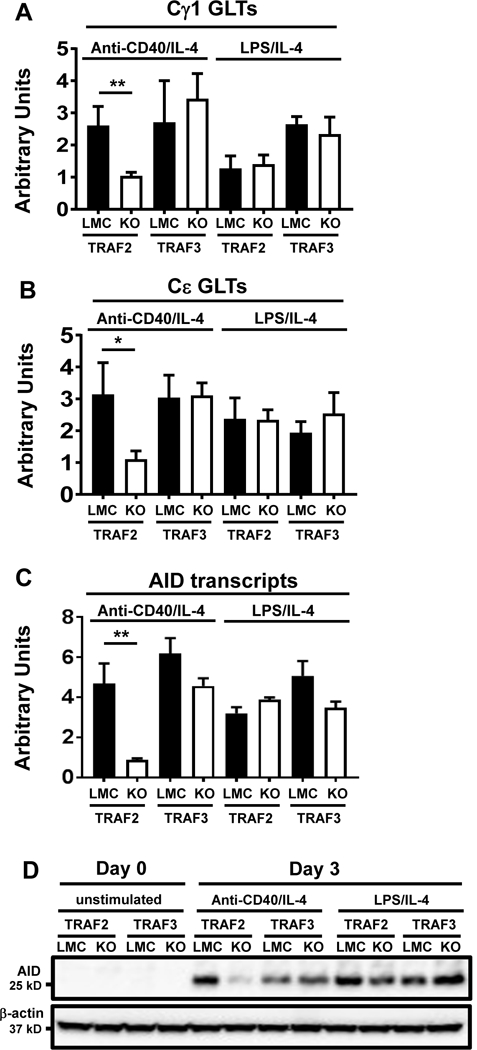
Quantitative RT-PCR (qPCR) data of relative transcripts of Cγ1 GLT (A), Cμ GLT (B) and AID (C). Purified B cells of indicated genotypes were stimulated with anti-CD40/IL-4 or LPS/IL-4 for 2 days. qPCR was conducted as described in Materials and Methods. Statistical significance analysis was performed by student t test, **p<0.01, *p<0.05. (D) Western blot of AID protein expression in the indicated B cells that were either unstimulated (day 0) or stimulated with anti-CD40/IL-4 or LPS/IL-4 for 3 days. β-actin is the loading control. LMC: littermate control (TRAF2fl/fl or TRAF3fl/fl). 2KO: B-TRAF2-KO. 3KO: B-TRAF3-KO. All experiments were repeated three times independently and representative data from one experiment are shown.