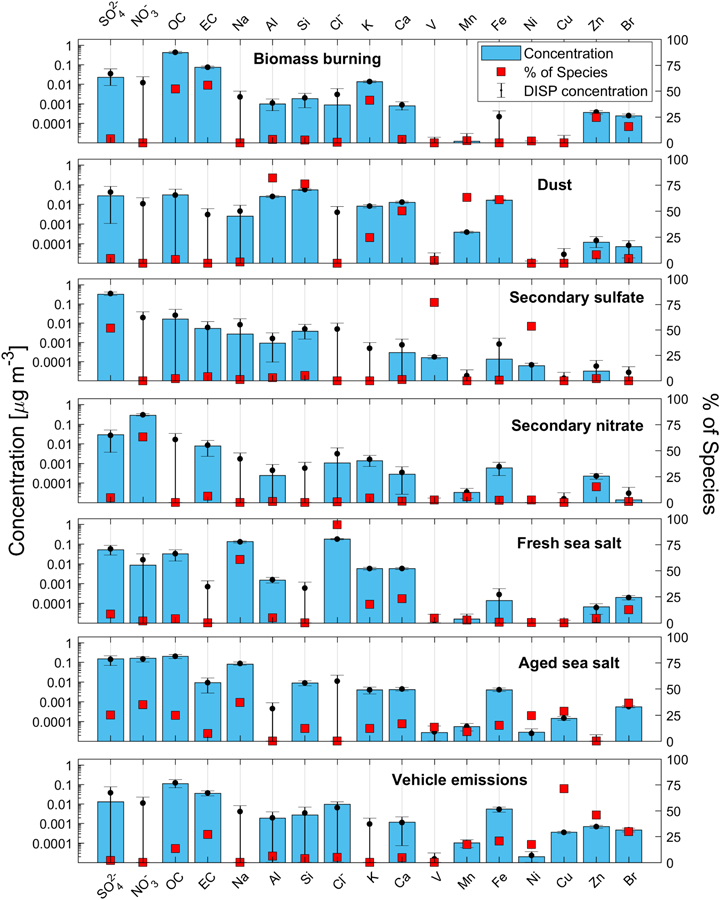
Figure 3.

Seven source factor profiles from PMF analysis using chemically-speciated PM2.5 data from PNM IMPROVE station. Blue bars represent the mass concentration of the species while red filled markers signify the percent contribution of a particular source factor to the mass sum of a species’ overall concentration. Black circles and error bars represent mean and range, respectively, of DISP values of the species mass concentration.
