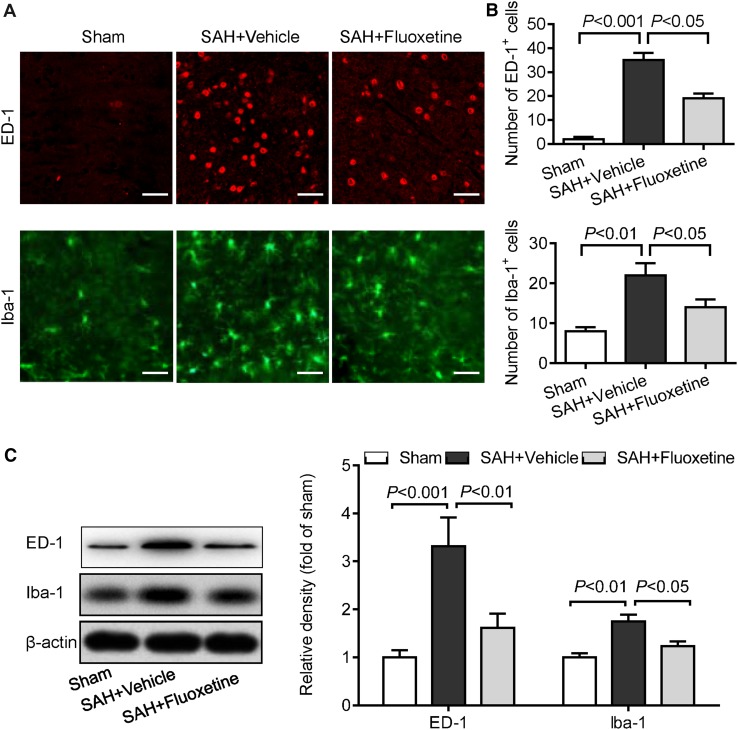
Fig. 3.
Fluoxetine attenuates microglial activation in basal cortex after SAH. A Representative images show ED-1 (red) and Iba-1 staining (green) in basal cortex (scale bars, 20 µm). B Quantitative analysis of ED-1 and Iba-1 positive cells. C Representative Western blots of ED-1 and Iba-1 in cortex 72 h after surgery in the sham, SAH + vehicle, and SAH + fluoxetine groups. Values are represented as the mean ± SEM (n = 6/group; one-way ANOVA followed by Turkey’s test).

