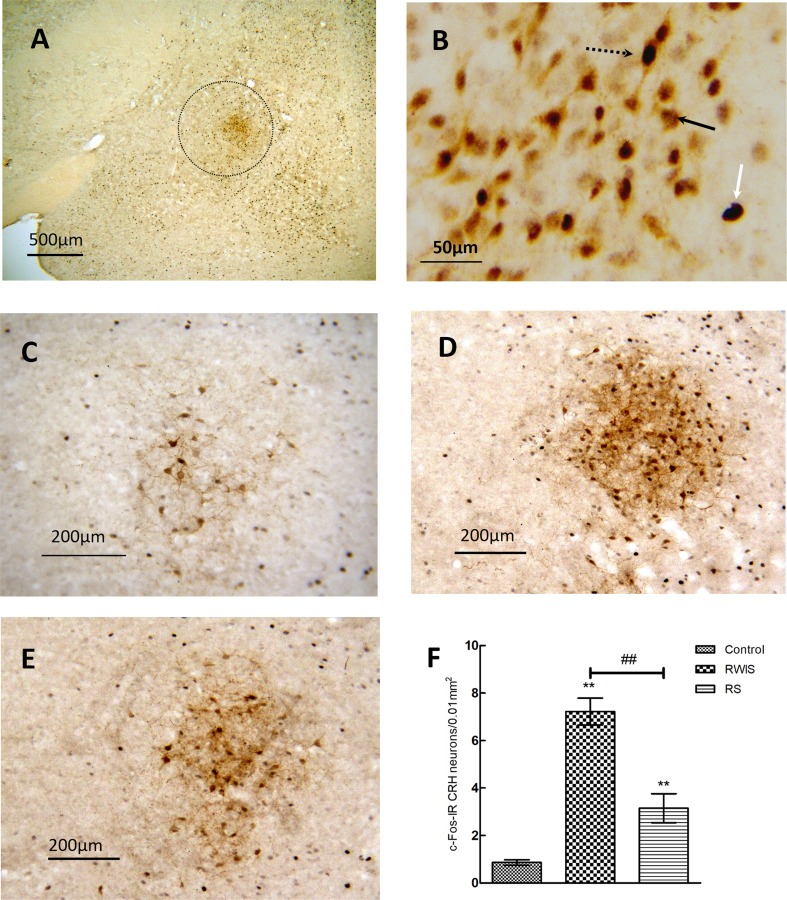
Fig. 4.
Expression of c-Fos in CRH neurons in the CEA. A Example image of c-Fos expression in CRH neurons in the CEA (outlined) from the RWIS group at 40× magnification. B Example image of dual immunohistochemical staining for c-Fos and CRH-IR neurons in the CEA. White arrow, a c-Fos-IR neuron; black arrow, a CRH-IR neuron; dotted black arrow, a c-Fos-IR CRH neuron. C–E Example images of c-Fos expression in CRH neurons from the CEA of control (C), RWIS (D), and RS groups (E), at 200× magnification. F Comparisons of number of c-Fos-IR CRH neurons between groups. Data represent the mean ± SEM (n = 10/group). **P < 0.01 compared with control; ##P < 0.01 between RWIS and RS groups.

