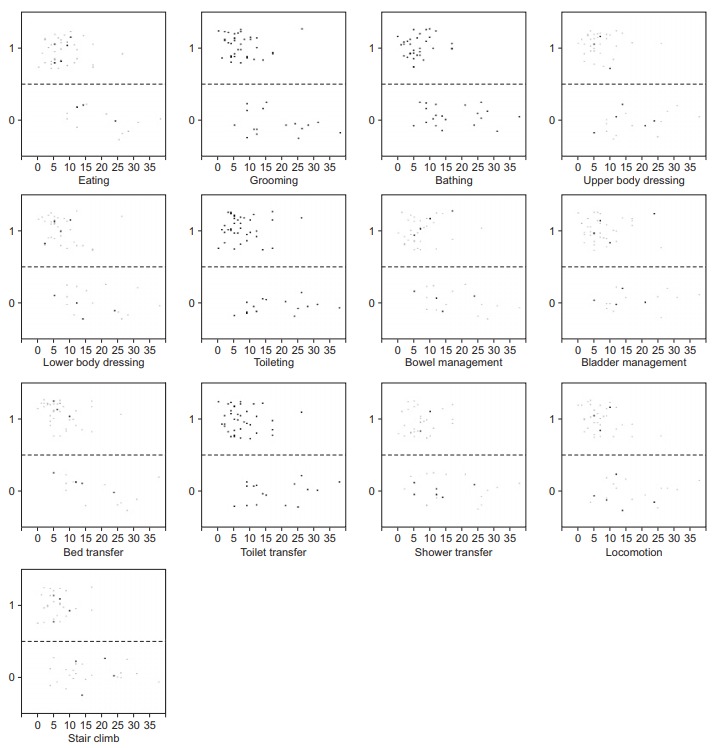
Fig. 3.

Scatter diagrams showing the total score of the National Institutes of Health Stroke Scale on the x-axis, and independence or dependence of Functional Independence Measure defined in the text on the y-axis in 53 patients of the model-development group (1=independence, 0=dependence).
