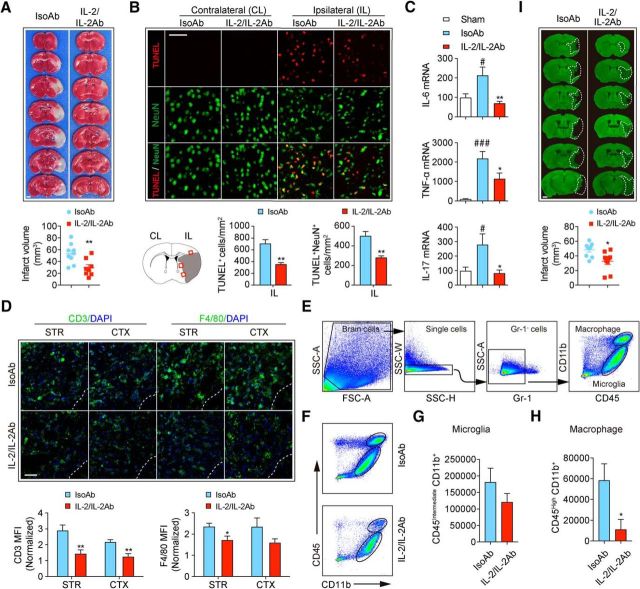
Figure 3.
IL-2/IL-2Ab treatment reduces ischemic brain injury. C57BL/6 mice were pretreated with IL-2/IL-2Ab complex or IsoAb intraperitoneally for 3 d before tMCAO. A, Quantification of TTC staining for brain infarct 3 d after ischemic stroke. n = 8–9/group. Scale bar, 1 mm. B, Quantification of cell death (TUNEL+) and neuronal death (TUNEL+NeuN+) in peri-infarct areas (shown in the schematic) 3 d after tMCAO. n = 4–5/group. Scale bar, 100 μm. C, mRNA expression of IL-6, TNF-α, and IL-17 in sham and ischemic brains was quantified using RT-PCR 3 d after tMCAO. n = 5–6/group. D, Top, Representative images of CD3 (green)/DAPI (blue) T cells and F4/80 (green)/DAPI (blue) monocyte/macrophages and microglia in striatum and cortex in the peri-infarct areas. Scale bar, 100 μm. Bottom, Quantification of the mean fluorescent intensity (MFI) for CD3+ staining (n = 5–6/group) and F4/80+ staining (n = 6–8/group). Data are normalized to the contralateral levels. E–H, Flow cytometric analysis of CD45highCD11b+ macrophages and CD45intermediateCD11b+ microglia in the ischemic brain. E, Gating strategy. F, Representative FACS plots for microglia and macrophages in the brains of IsoAb or IL-2/IL-2Ab-treated stroke mice. G, H, Quantification of the numbers of CD45intermediateCD11b+ microglia (G) and CD45highCD11b+ macrophages (H) per ischemic brain of IsoAb or IL-2/IL-2Ab-treated stroke mice. n = 5/group. I, Infarct volume was measured by MAP2 immunostaining 7 d after tMCAO. n = 9/group. Scale bar, 1 mm. *p < 0.05, **p < 0.01 versus IsoAb; #p < 0.05, ###p < 0.001 versus sham.

