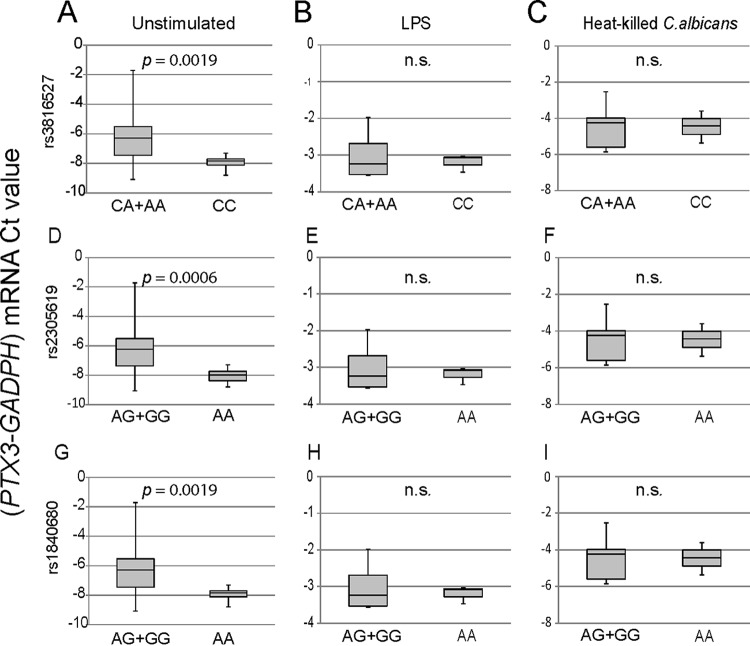
FIG 4.
Impact of PTX3 SNPs on PTX3 mRNA expression. After genotyping and processing of buffy coats, monocytes were cultured in the presence and absence of a stimulus (LPS or heat-killed C. albicans) for 6 h. PTX3 transcripts were amplified by quantitative reverse transcription-PCR in duplicate, and the expression level from each sample was calculated as the difference between the mean CT values of the targeted gene (PTX3) and the mean CT values of the housekeeping gene (GAPDH) (y axis, PTX3-GAPDH mRNA CT value). For each SNP, two comparisons of genetic groups were performed: CC and CA+AA for rs3816527 and AA and AG+GG for both intronic SNPs (rs2305619 and rs1840680). The groups passed the Shapiro-Wilks normality test. PTX3 mRNA expression values in monocytes for the indicated genotypes in the absence (A) and presence (B and C) of stimuli are presented in box plot graphs. Results represent data from at least three independent experiments. P values determined by Welch’s t test are shown. n.s., not significant.

