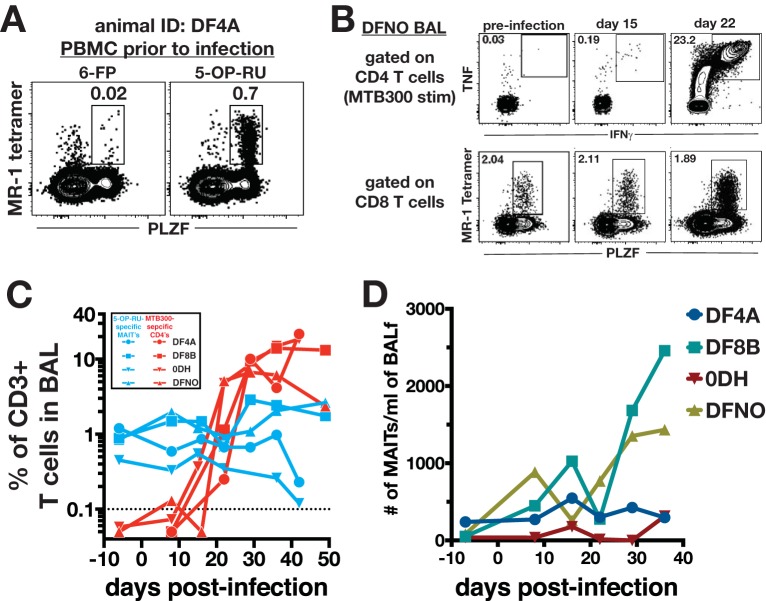
FIG 1.
Kinetics of MAIT versus conventional M. tuberculosis-specific CD4 T cell responses in the airways following M. tuberculosis infection. (A) Sample fluorescence-activated cell sorting (FACS) plots of MR-1 tetramer staining specificity. PBMCs from an animal prior to infection were stained with 5-OP-RU-loaded rhesus macaque MR-1 tetramers. 6-FP-loaded tetramers served as a negative control. MAITs were identified as CD3+ CD8+ PLZF+ tetramer-binding T cells. (B) Sample FACS plots of MAITs and peptide-specific Th1 cells following infection with ∼40 to 80 CFU of M. tuberculosis Erdman-mCherry. M. tuberculosis-specific CD4 T cells were identified by intracellular cytokine staining for IFN-γ and TNF after a 6-h stimulation with the MTB300 peptide megapool. CD4 T cells were identified as CD3+ CD4+ CD8− cells. MAITs were identified as for panel A. (C) Summary graphs of the kinetics of MAIT and MTB300-specific CD4 T cells in the airways following M. tuberculosis infection. In order to allow for direct comparison of their relative abundances, the frequencies of both populations are expressed as a percentage of total live CD3+ cells. (D) Summary graph of the number of MAIT cells per milliliter of bronchoalveolar lavage fluid.

