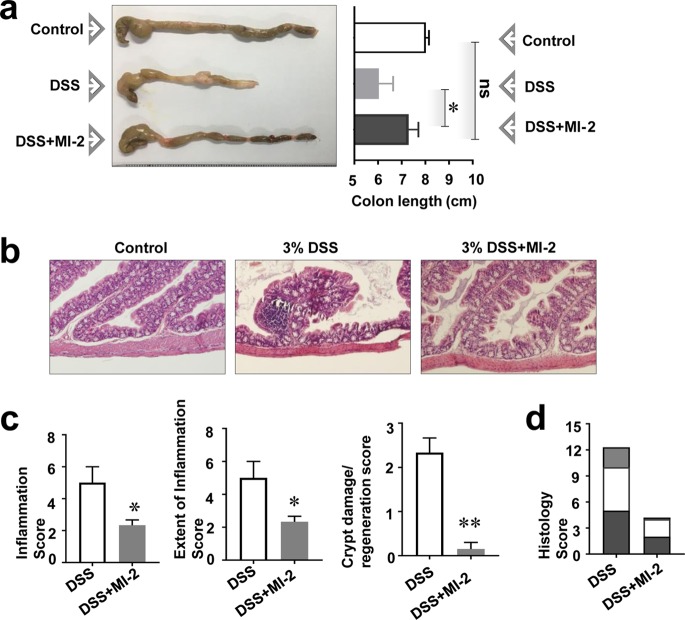
FIG 2.
MI-2 restores intestinal tissue damage in DSS-induced colitis. (a) Colon length in control, DSS, and DSS plus MI-2 groups are shown. (Left) Images of colons are representative of three independent experiments (n = 10 to 15 mice per group). (Right) The graph shows the mean values ± standard errors of colon lengths pooled from three independent experiments (n = 10 to 15 mice per group). (b) Representative images of colon tissue sections stained with H&E from three independent experiments (n = 10 to 15 mice per group). (c) Level of crypt damage/regeneration, extent of inflammation, and inflammation score for each sample. Graphs show pooled results from three independent experiments (n = 10 to 15 mice per group). (d) Histological scores calculated based on crypt damage/regeneration, extent of inflammation, and inflammation scores (from panel c) for DSS and DSS plus MI-2 mice. P values were <0.05 (*) and <0.01 (**) versus control (untreated) cells (two-tailed unpaired Student's t test). Error bars denote SEM.

