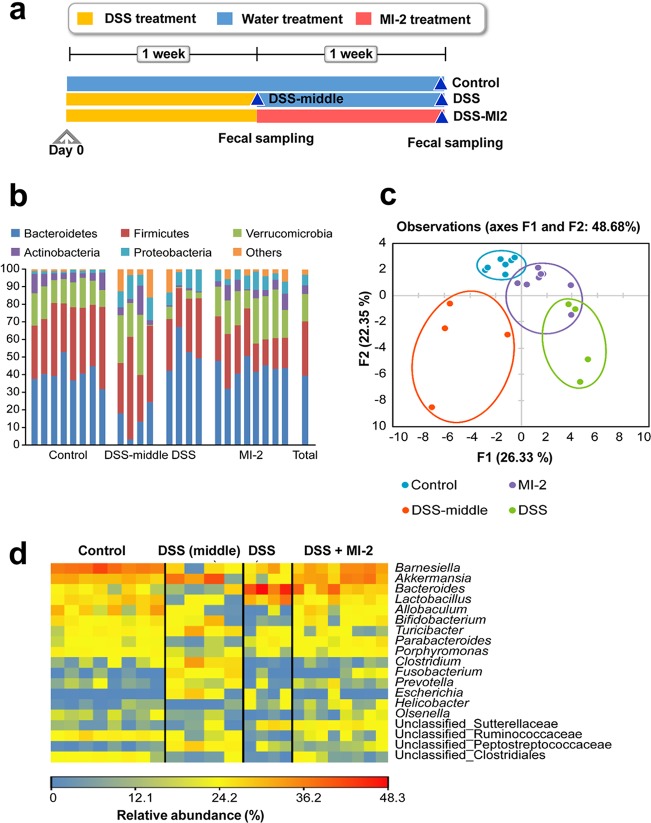
FIG 4.
Altered intestinal microbiome composition in MI-2-treated mice with DSS-induced colitis. (a) Microbiome profiles of control, DSS-middle, DSS, and DSS plus MI-2 mice. (b) Relative abundance of phyla in each group. Phyla accounting for <5% of total sequences were combined as Others. Total is the relative abundance of total sequences across all 24 samples in the four groups. (c) PCA of intestinal microbiota. Forty-one OTUs accounting for at least 0.5% of total sequences across all 24 samples in the four groups were included in the analysis. (d) Heat map showing the relative abundance of key bacteria. Genera and unclassified groups accounting for >0.5% of total sequences and differing significantly among the four groups were regarded as key bacteria.

