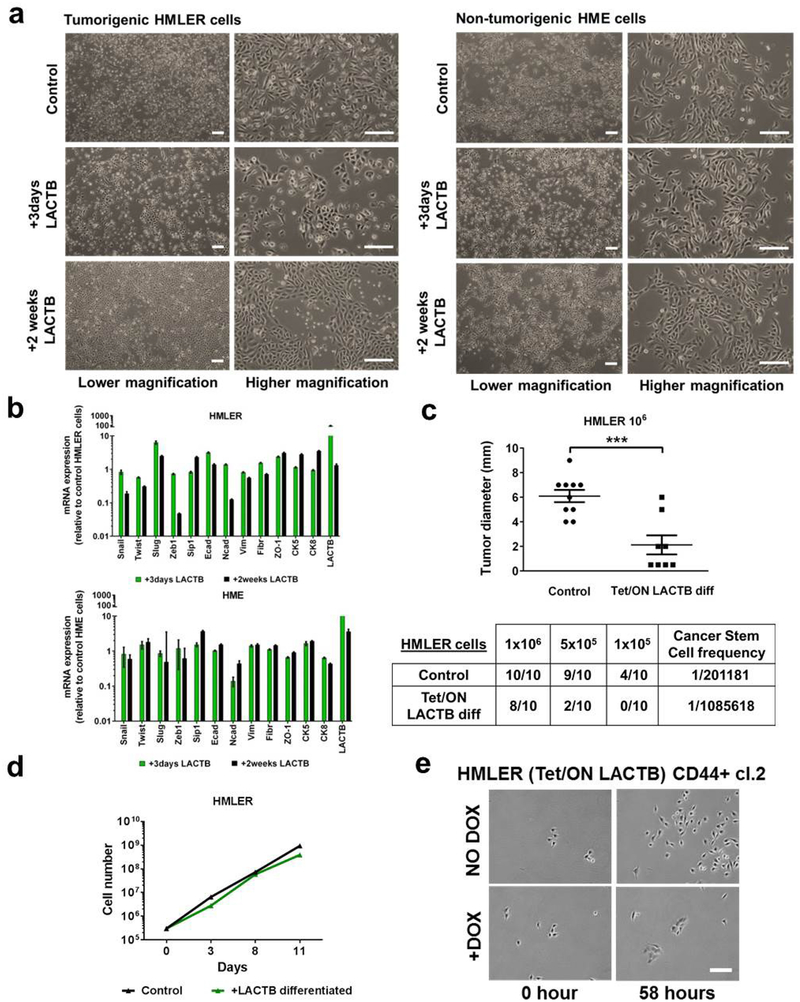
Extended Data Figure 5 |. LACTB-induced effects on HMLER differentiation.
a, Light-microscopy images of HMLER and HME cells upon LACTB induction. Scale bars, 200 μm. b, qRT–PCR analysis of relative mRNA levels of mesenchymal, stem-cell and epithelial markers in tumorigenic HMLER and non-tumorigenic HME cells upon LACTB induction. All values are relative to control HMLER or HME cells in which LACTB was not induced. GAPDH expression was used as a normalization control. c, Frequency of cancer stem cells in control HMLER cells and in differentiated HMLER cells where LACTB was induced in vitro for two weeks. Cells were injected at limiting dilutions (1 × 10⁶, 5 × 10⁵, 1 × 10⁵) into fat pads of female NOD/SCID mice. Mice were euthanized 8 weeks after injection and tumour frequency and tumour diameter were calculated and measured. Diameters of tumours arising from the group injected with 1 × 10⁶ cells are shown. ***P<0.001. d, Proliferation curves of control HMLER cells and differentiated HMLER cells. e, Time-lapse images of HMLER–Tet/ON-LACTB CD44highCD24low single-cell clone 2 with (+DOX) or without (no DOX) LACTB induction. Scale bar, 200 μm. Videos of clones 1 and 2 can be found in the Supplementary Information. Data are mean ± s.e.m. (b, c).

