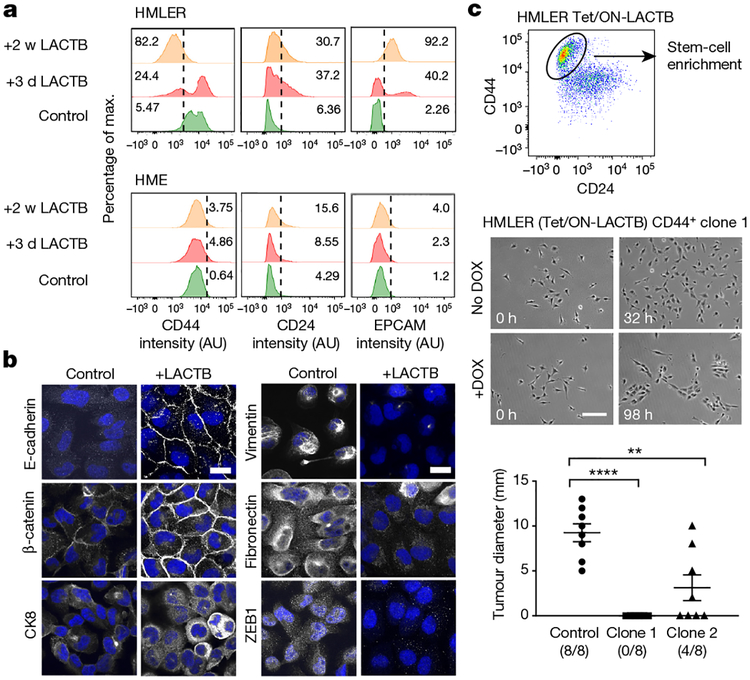
Figure 3 |. LACTB-induced effects on cancer cell differentiation.
a, Flow cytometry analysis of a marker of stem cells (CD44) and markers of epithelial differentiation (CD24, EPCAM) in tumorigenic HMLER and non-tumorigenic HME cells upon LACTB induction. Numbers within the graphs represent percentages of gated cells, the dashed line indicates the gate. b, Immunofluorescence staining of HMLER cells after LACTB induction for two weeks. Epithelial (E-cadherin, β-catenin, cytokeratin 8 (CK8)), mesenchymal (vimentin, fibronectin) and stem-cell (Zeb1) markers are shown in white, DAPI is shown in blue. Scale bars, 30 μm. Representative images of two independent experiments are shown. c, Gating strategy for single-cell clone generation (top). Growth, morphology and tumorigenicity of two single-cell clones after LACTB induction was monitored by live time-lapse imaging (growth and morphology analysis, middle) and orthotopic injections into mice (tumorigenicity analysis, bottom). Time-lapse videos of the growth of clones 1 and 2 can be found in the Supplementary Information. Scale bar, 200 μm. Data are mean ± s.e.m. **P < 0.01; ****P <0.0001.

