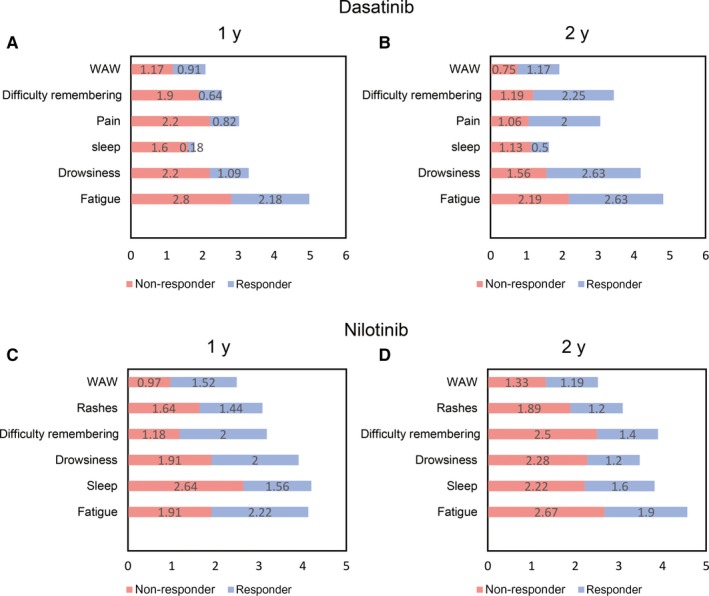
Figure 3.

Top five symptom mean score comparison between responders and non‐responders with dasatinib and nilotinib. Stacked bar graphs representing symptom mean score comparison between responder and non‐responder groups (≥MMR at 1 y; ≥CMR at 2 y). Panel A, Dasatinib at 1 y from baseline; Panel B, Dasatinib at 2 y from baseline; Panel C, nilotinib at 1 y from baseline; Panel D, nilotinib at 2 y from baseline. WAW, work, activity, and walk; REM, relations with others, enjoyment of life, and mood; Sleep, disturbed sleep; Rashes, skin rash. The majority of symptoms did not show statistical significance
