
Figure 2.
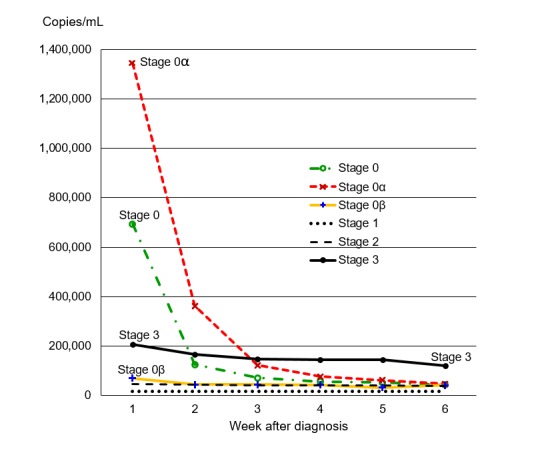
Median earliest viral load (in copies/mL) by week after diagnosis and stage of disease at diagnosis of HIV infection, comparing stages 0, 1, 2, and 3 and stage 0 subcategories 0α (0A+0B+0C+0D+0E) and 0β (0F).
Official websites use .gov
A
.gov website belongs to an official
government organization in the United States.
Secure .gov websites use HTTPS
A lock (
) or https:// means you've safely
connected to the .gov website. Share sensitive
information only on official, secure websites.
Median earliest viral load (in copies/mL) by week after diagnosis and stage of disease at diagnosis of HIV infection, comparing stages 0, 1, 2, and 3 and stage 0 subcategories 0α (0A+0B+0C+0D+0E) and 0β (0F).