Figure 4.
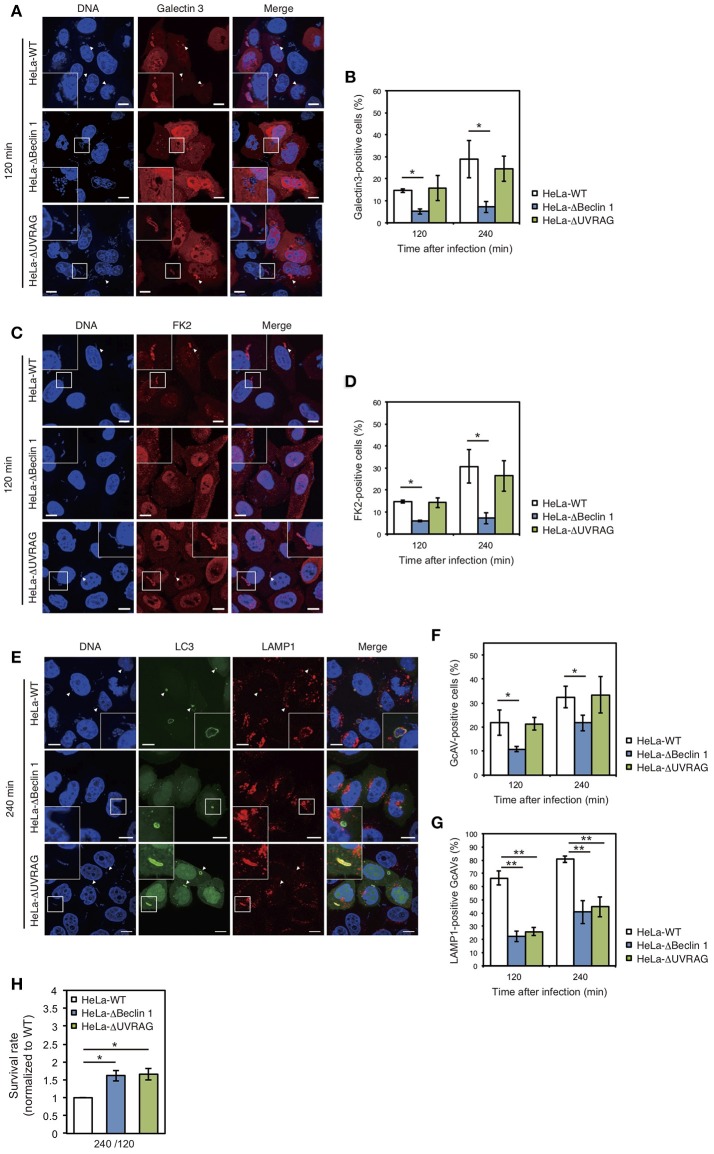
The NLRX1–Beclin 1–UVARAG complex regulates Group A Streptococcus (GAS)-induced autophagy. (A) HeLa wild-type, Beclin 1, and UVRAG KO cells transfected with mCherry-Galectin3 were infected with GAS for 120 min. Cellular and bacterial DNA was stained with DAPI. White arrowheads show Galectin3-positive cells. Scale bars, 10 μm. (B) Quantification of the number of Galectin3-positive HeLa wild-type, Beclin 1, and UVRAG KO cells. Data are mean ± SD for 200 GAS-infected cells counted per each experiment (n = 3). *P < 0.05. (C) HeLa wild-type, Beclin 1, and UVRAG KO cells were infected with GAS for 120 min and stained with antibody to FK2 and then with Alexa 594-conjugated secondary antibody to visualize ubiquitin-positive GAS. Cellular and bacterial DNA was stained with DAPI. White arrowheads show FK2-positive GAS. Scale bars, 10 μm. (D) Quantification of the number of FK2-positive HeLa wild-type, Beclin 1, and UVRAG KO cells. Data are mean ± SD for 200 GAS-infected cells counted per each experiment (n = 3). *P < 0.05. (E) HeLa wild-type, Beclin 1, and UVRAG KO cells were transfected with EmGFP-LC3 and infected with GAS for 240 min; cells were stained with antibody against LAMP1 and then with Alexa 594-conjugated secondary antibody. Cellular and bacterial DNA was stained with DAPI. White arrowheads show LAMP1-positive GcAVs. Scale bars, 10 μm. (F) Quantification of the number of GcAV-positive HeLa wild-type, Beclin 1, and UVRAG KO cells. Data are mean ± SD for 500 GAS-infected cells counted per each experiment (n = 3). *P < 0.05. (G) Co-localization rate of GcAVs with lysosomes in HeLa wild-type, Beclin 1, and UVRAG KO cells at the indicated times after infection. Data are mean ± SD of 200 GAS-infected cells counted per each experiment (n = 3). **P < 0.01. (H) The rate of intracellular survival of GAS bacteria in HeLa wild-type, Beclin 1, and UVRAG KO cells. Each cell type was infected with GAS, and the number of intracellular viable GAS bacteria was determined by colony counting and is presented as the ratio of intracellular live GAS bacteria at 240 min to intracellular GAS bacteria at 120 min. Data are representative of three independent experiments.

