
FIG 2.
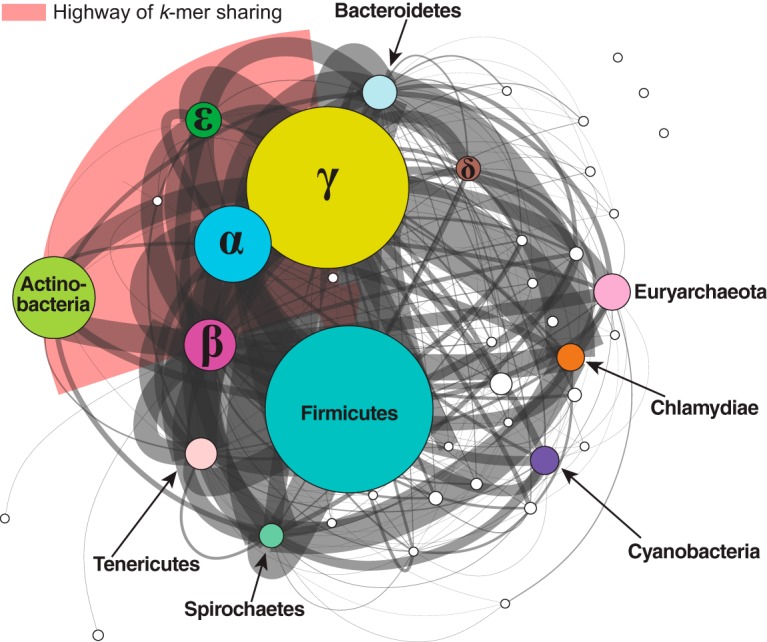
P-network of 2,705 prokaryote genomes based on whole-genome data. The network was generated using D2S with k = 25 at t = 3. Each node represents a distinct phylum (or proteobacterial group), with major representative nodes labeled. Each edge between two nodes represents the number of genome pair connections between the two nodes. The thickness of each edge is proportional to the number of genome pairs with shared k-mers. The size of each node is proportional to the number of isolates within the phylum. The five representative Proteobacteria groups are labeled with the corresponding Greek characters. The highway of k-mer sharing between Betaproteobacteria and Gammaproteobacteria is indicated in red. A dynamic view of this figure is available at http://bioinformatics.org.au/tools/AFmicrobes/.