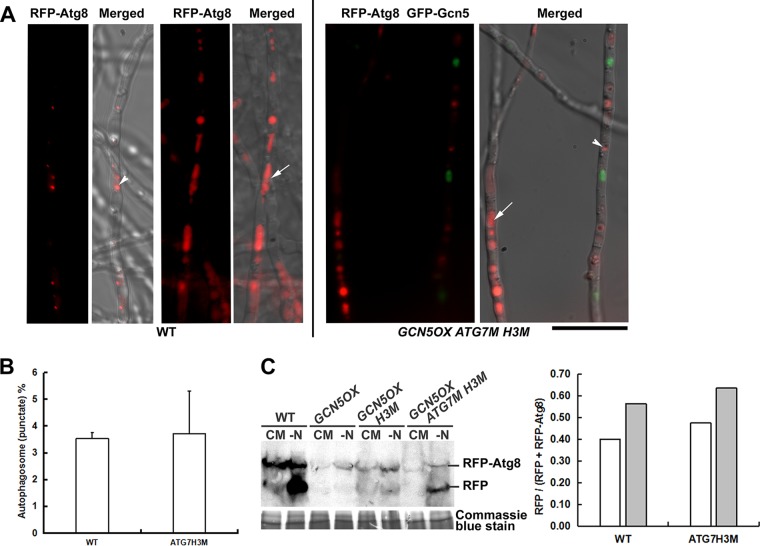
FIG 2.
Epigenetic and posttranslational regulation of nitrogen-induced autophagy in M. oryzae. (A) Autophagic activity visualized by RFP-Atg8 signal under nitrogen starvation. Representative images for WT or GCN5OX ATG7M H3M mycelia are presented. Vacuolar RFP signal (white arrows), autophagosome (white arrowheads) are indicated. Bar = 5 μm. (B) Quantification of autophagy activity by calculating the percentage (mean ± standard error [SE]) of mycelial area labeled by RFP-Atg8 as autophagosomes or autophagic vacuoles by using software ImageJ (https://imagej.nih.gov/ij/) and the “Analyze>Analyze Particles” function. More than 10 pieces of mycelia were used for such quantification in each instance. (C) Total protein lysates from WT, GCN5OX, GCN5OX H3M, and GCN5OX ATG7M H3M strain were analyzed by immunoblotting with anti-RFP antibodies (rabbit; 1:1,000; Clontech, catalog no. R10367). The presence of free RFP band indicates induction of autophagy. The extent of autophagy was estimated by calculating the amount of free RFP compared with the total amount of intact RFP-Atg8 and free RFP and presented in the bar chart for WT and GCN5OX ATG7M H3M strains. Densitometric analysis was performed by ImageJ (https://imagej.nih.gov/ij/). Coomassie blue stain of the total protein lysates serves as a loading control.

