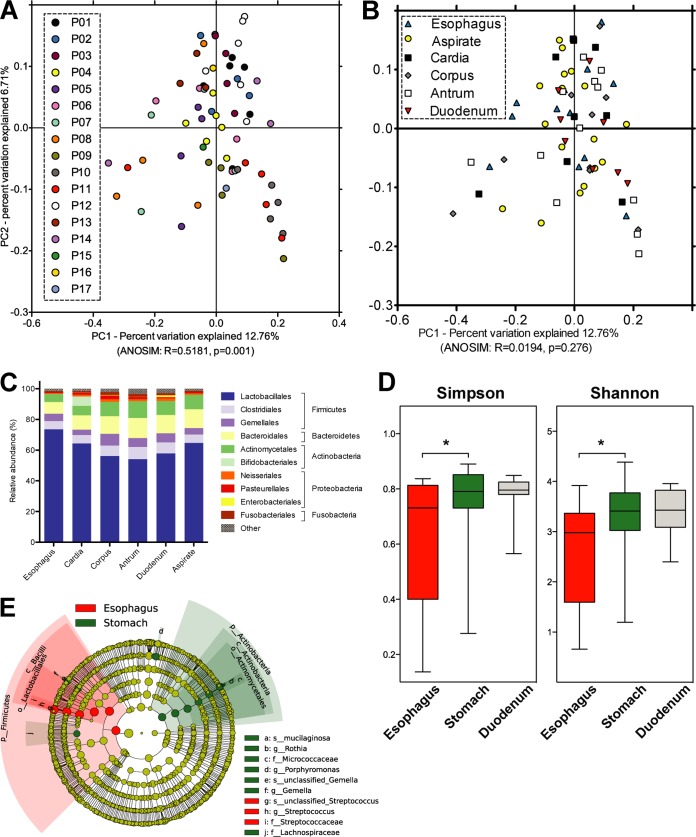
FIG 2.
Mucosal microbiota analysis of the human stomach in relation to esophagus and duodenum. (A and B) Principal-coordinate analysis (PCoA) plots of microbiota comparisons of biopsy samples based on taxonomic distance (unweighted UniFrac), showing significant differences between patients (A) but not between sampled locations (B). Significance was determined with a nonparametric analysis of similarity (ANOSIM) test, using 999 permutations, as implemented in QIIME (64). (C) Mean relative microbiota compositions of all upper GI samples at the taxonomic order and phylum levels, including all OTUs with ≥1% relative abundance in at least one sample, excluding samples from H. pylori-positive patients. (D) Cladogram showing bacterial taxa with differential relative abundances, from kingdom (innermost ring) to species (outermost ring), between esophagus and stomach biopsy samples from H. pylori-negative patients, using a linear discriminant analysis (LDA) effect size of >2.0 as determined with LEfSe (65). Circle diameters used to represent taxa are proportional to their relative abundances. Circle colors indicate a significant increase in esophagus samples (red) or in stomach samples (green) or no difference between the two sample types. Shaded circle fractions in red and green mark the lower taxonomic groups that comprise each taxon with significantly different relative abundances in the two sample groups.

