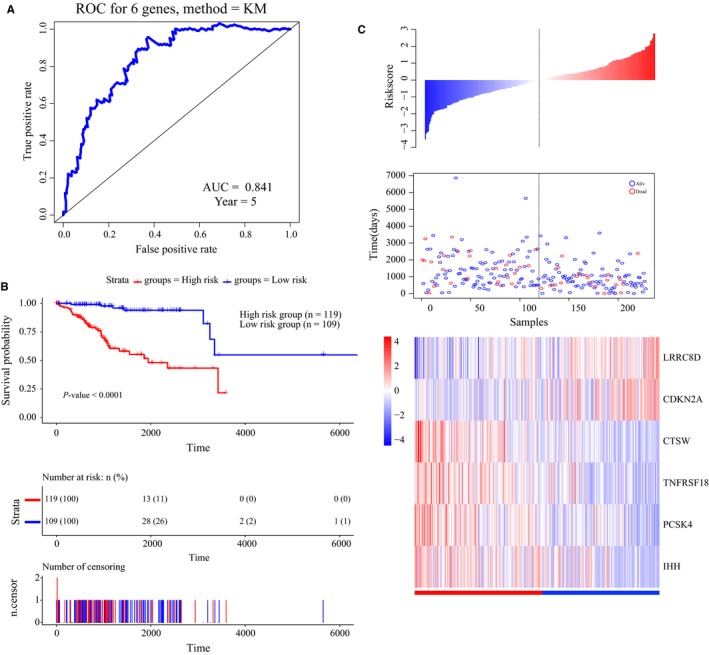
Figure 4.

Construction of a prognostic risk scoring system based on the six‐gene signature. A, Time‐dependent receiver operating characteristic (ROC) curve for predicting the 5‐year survival. B, Kaplan‐Meier survival curve of samples divided into high‐ and low‐risk groups according to the optimum cut‐off point (log‐rank test P‐value <0.0001). C, Six‐gene signature‐based risk score, patient survival results, and gene expression heatmap
