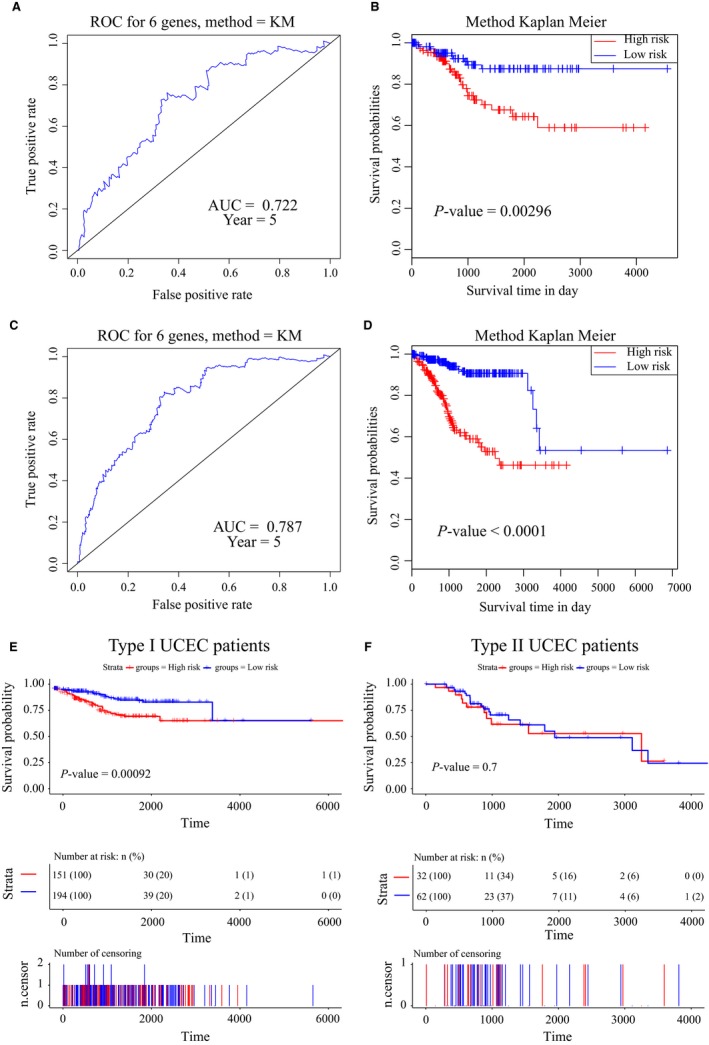
Figure 5.

Validation of the six‐gene signature in the validation and entire datasets. A, Time‐dependent receiver operating characteristic (ROC) curve for predicting the 5‐year survival in the validation dataset. B, Kaplan‐Meier survival curve of samples divided into high‐ and low‐risk groups in the validation dataset (log‐rank test P‐value = 0.00296). C, Time‐dependent ROC curve for predicting the 5‐year survival in the entire dataset. D, Kaplan‐Meier survival curve of samples divided into high‐ and low‐risk groups in the entire set (log‐rank test P‐value <0.0001). E, Kaplan‐Meier survival curve of Type I UCEC samples divided into high‐ and low‐risk groups in the entire set (log‐rank test P‐value <0.001). F, Kaplan‐Meier survival curve of Type II UCEC samples divided into high‐ and low‐risk groups in the entire set (log‐rank test P‐value >0.05)
