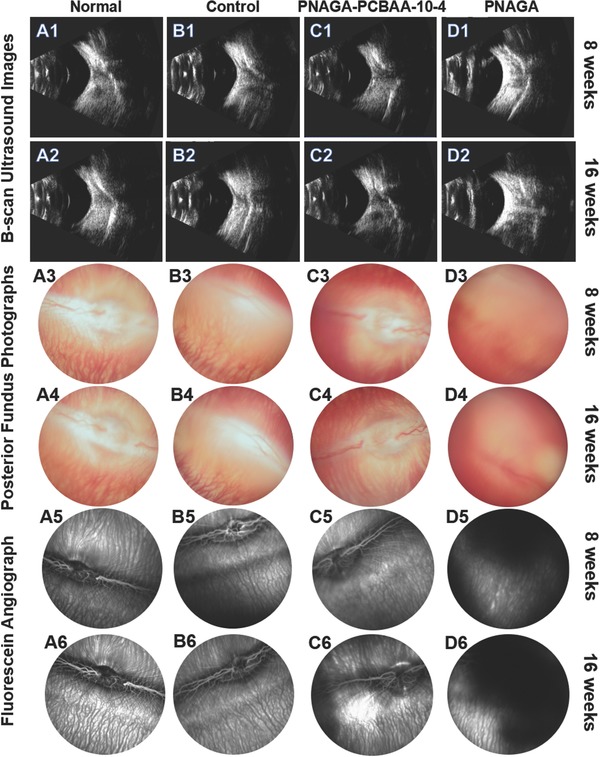
Figure 3.

B‐scan ultrasound images, postoperative posterior fundus photographs, and fluorescein angiographs of the four groups' eyes at 8 weeks and 16 weeks post operation. A1–A6) Normal rabbit eyes. B1–B6) Sham‐operated groups. C1–C6) PNAGA‐PCBAA‐10‐4 hydrogel groups. D1–D6) PNAGA hydrogel groups.
