
Figure 3.
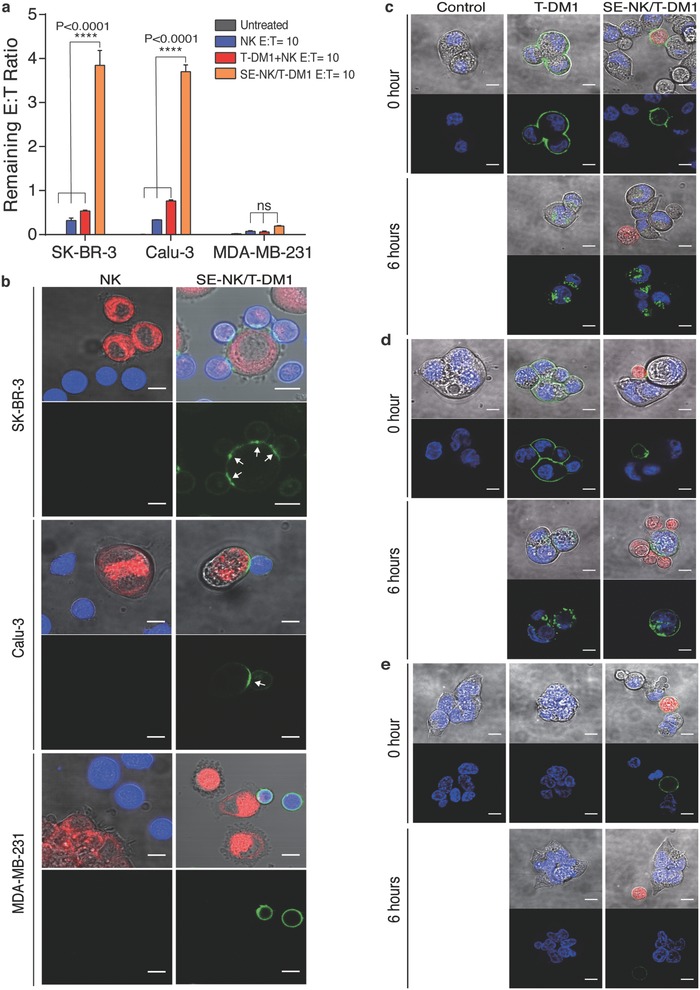
ADCs embedded on the cell surface deliver the immune cells toward the target cancer cells then transfer and internalize into the target cancer cells. a) Binding of SE‐NK/T‐DM1 cells to the HER2‐positive cancer cells. Cancer cells were coincubated with NK cells, SE‐NK/T‐DM1 cells, or T‐DM1+NK cotreatment at an E:T ratio of 10:1. After 30 min, unbound cells were thoroughly washed and the remaining NK cells were counted using flow cytometry to calculate the remaining E:T ratio. Cancer cells were labeled in red with CellTracker Red CMTPX and NK cells were labeled in blue with CellTracker Blue CMAC. Data represent mean ± SD (ns, not significant; ****P < 0.0001, by one‐way ANOVA with Bonferroni post hoc tests). b) Confocal microscopy images showing the binding of SE‐NK/T‐DM1 cells and transfer of T‐DM1 from SE‐NK/T‐DM1 cells to SK‐BR‐3 cells, Calu‐3 cells, and MDA‐MB‐231 cells. Cancer cells (red) were coincubated with NK cells (blue) or SE‐NK/T‐DM‐FITC cells (NK cells in blue and T‐DM1 in green) at an E:T ratio of 10:1. Unbound effector cells were thoroughly washed after 30 min of coincubation and the remaining cells were observed in live by confocal microscopy. Polarization of T‐DM1‐FITC (green) at the effector cell‐to‐target cell junction is indicated with white arrows. DMPE‐PEG‐T‐DM1 was able to move across the SE‐NK/T‐DM1 cell membrane to the contact point and formed antigen–antibody complexes with HER2 expressed on cancer cells. Subsequently, the antigen–antibody complexes spread across the cancer cell membrane through membrane fluidity. Scale bars: 10 µm. All data are representative of two independent experiments. c–e) Internalization of transferred T‐DM1 into HER2‐positive SK‐BR‐3 cells, HER2‐positivie Calu‐3 cells, and HER2‐negative MDA‐Mb‐231. Cancer cells labeled with nuclear staining dye (blue) were seeded on an eight‐chambered cover glass slide and incubated SE‐NK/T‐DM1‐FITC cells (NK cells in red, T‐DM1 in green) at an E:T ratio of 10:1. For a comparison, FITC‐labeled T‐DM1 (green) was treated to each cancer cells. Unbound NK cells were thoroughly removed after 30 min of incubation and the remaining cancer cell‐bound NK cells were imaged by confocal microscopy to detect internalized T‐DM1 in the cancer cell cytoplasm. Images were taken at the initial time point of treatment and 6 h later. Scale bars: 10 µm. All data are representative of two independent experiments.