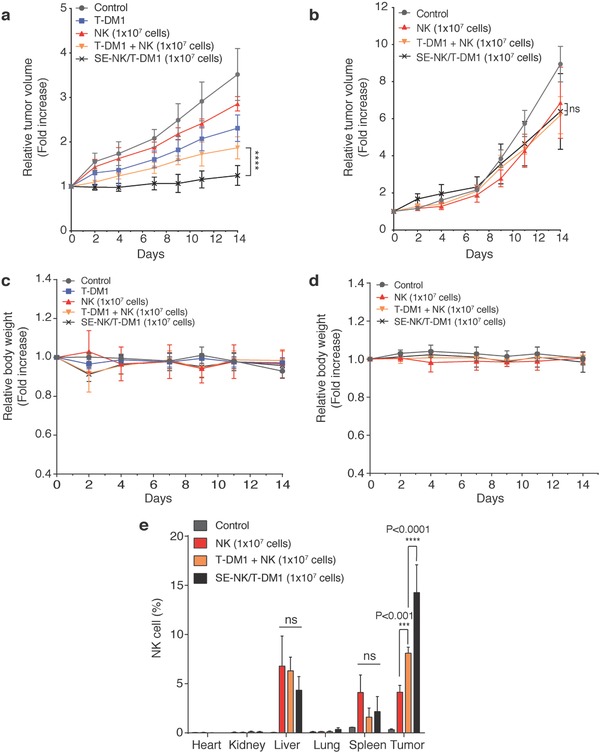
Figure 6.

SE‐NK/T‐DM1 cells exhibit superior anticancer efficacy against HER‐2 positive cancer. a,b) Relative tumor volume change of HER2‐positive Calu‐3 cancer or HER2‐negative MDA‐MB‐231 cancer. Tumors were inoculated on the left flank of female NOD scid Gamma (NSG) mice. Tumor‐bearing mice (n = 4, except for the control group in MDA‐MB‐231 cells that had n = 3) received weekly treatment of no treatment, 0.21 mg of T‐DM1, 1 × 10⁷ NK cells, 0.21 mg of T‐DM1+1 × 10⁷ NK cotreatment, or 1 × 10⁷ SE‐NK/T‐DM1 cells through tail vein infusion for 14 d. Compared to T‐DM1+NK cell cotreatment, SE‐NK/T‐DM1 cells significantly suppressed the tumor growth. All agents were freshly prepared in 250 µL of PBS and the infusion was scheduled for 1 min. Data represent mean ± SD (****P < 0.0001, two‐way repeated measure ANOVA with Bonferroni post hoc tests). c,d) Body weight change of Calu‐3 models and MDA‐MB‐231 models. e) Biodistribution of SE‐NK/T‐DM1 cells in Calu‐3 tumor‐bearing NSG mice (n = 3). Animals received no treatment, 1 × 10⁷ NK cells, 0.21 mg of T‐DM1+1 × 10⁷ NK cotreatment, or 1 × 10⁷ SE‐NK/T‐DM1 cells through tail vein infusion. All agents were freshly prepared in 250 µL of PBS for 1 min infusion. Tumor and other vital organs were harvested at 24 h post‐treatment. Single‐cell suspension was prepared from the harvest tissues and APC‐conjugated anti‐CD56 antibodies were applied to detect NK cells. Flow cytometer was used to count NK cells among 1 × 10⁵ total cells. Data represent mean ± SD (ns, not significant; ***P < 0.001; ****P < 0.0001; two‐way ANOVA with Bonferroni post hoc tests).
