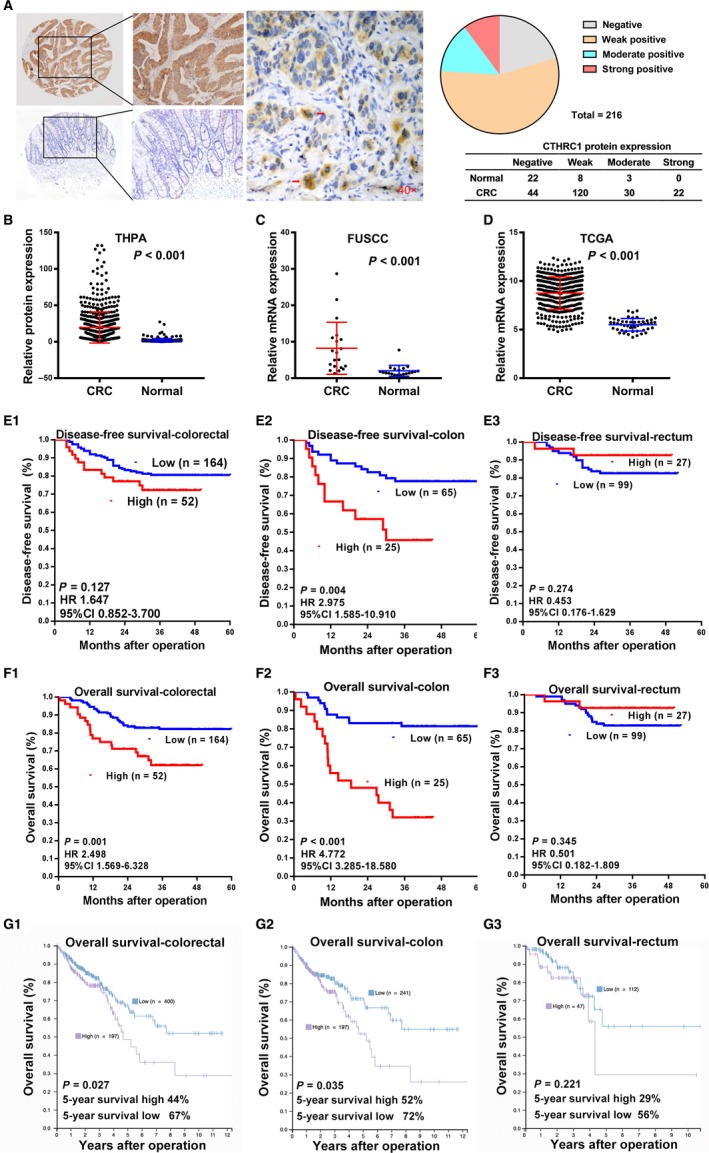
Figure 1.

CTHRC1 expression in human CRC. A, Representative immunohistochemical analysis of CTHRC1 in CRC (upper left) and normal colorectal mucosa (lower left) samples. CTHRC1 staining was increased in tumor buds of cancerous tissues (middle, red arrows). Pie chart presenting the CTHRC1 staining groups in CRC (n = 216) and normal mucosa samples (n = 33). B, Analysis of THPA data indicating elevated CTHRC1 protein expression in 597 CRC samples compared to that of adjacent normal tissue samples (196 transverse mucosa and 149 normal sigmoid mucosa samples) (mean ± SD, P < 0.001 with one‐way ANOVA). C, Relative mRNA expression of CTHRC1 was detected by RT‐qPCR in 20 pairs of primary CRC samples and adjacent colorectal mucosa samples. β‐actin was used as an internal control. The data are presented as the mean ± SD and compared by the Wilcoxon test. D, Analysis of TCGA data indicating that CTHRC1 expression is elevated in colorectal cancers (n = 224) compared with that of normal colorectal tissues (n = 22) (mean ± SD, with an unpaired t test). E, Kaplan‐Meier survival curve with log‐rank analysis of DFS according to the CTHRC1 expression in total CRC (E1), colon cancer (E2), and rectal cancer (E3). CTHRC1 expression was associated with DFS in colon cancer (E2), but not in total CRC (E1) or rectal cancer (E3). F, Kaplan‐Meier survival curve with log‐rank analysis of OS according to the CTHRC1 expression in total CRC (F1), colon cancer (F2), and rectal cancer (F3). CTHRC1 expression was associated with OS in total CRC (F1) and colon cancer (F2), but not in rectal cancer (F3). G, Kaplan‐Meier survival curves with log‐rank analysis of the colorectal cancer data in the THPA data set. Increased CTHRC1 mRNA expression was associated with poor OS in patients with CRC (G1) and colon carcinoma (G2), but not rectum carcinoma (G3)
