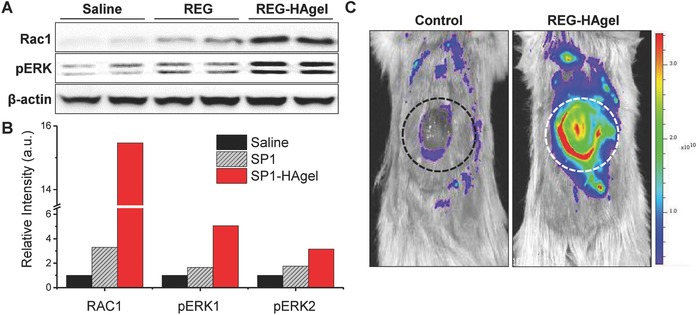
Figure 7.

FAK downstream signals affected by REG‐HAgel treatment in vivo. A) Western blot analysis of Rac1, pERK1/2, and β‐actin with treatment of saline, REG, and REG‐HAgel. B) Quantification of protein expression levels. C) Fluorescence image of MMP2 activity surrounding the wound bed using MMP2‐activatable probe.
