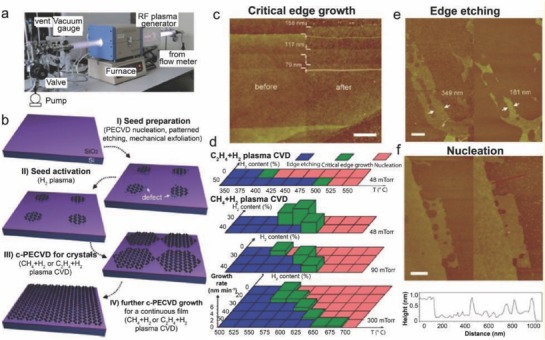
Figure 2.

a) Photograph of the remote radio frequency PECVD technique used during the experiment. b) Schematic representation of the c‐PECVD technique. c) AFM images of a graphene flake being peeled‐off before (left) and after (right) c‐PECVD growth. d) Experimental data are plotted as a function of the temperature and H2 content at 48, 90, and 300 mTorr. The blue, green, and red colors indicate the parameters for edge etching, critical edge growth, and cluster nucleation, respectively. The height of the green columns denotes the growth rate. e,f) AFM images of peel‐off graphene flakes after activation of the edges with a H2 plasma (250 mTorr, 500 °C) for 20 min (left columns), followed by CH4+H2 plasma CVD (30% H2, 300 mTorr, 550 °C) for 80 min [(e), right column] or CH4+H2 plasma CVD (20% H2, 300 mTorr, 600 °C) for 40 min [(f), right column]. The profile of the height along the red line is shown below the AFM image (f). Scale bars for (c,e,f) are maintained at 500 nm. Reproduced with permission.26 Copyright 2013, Wiley‐VCH.
