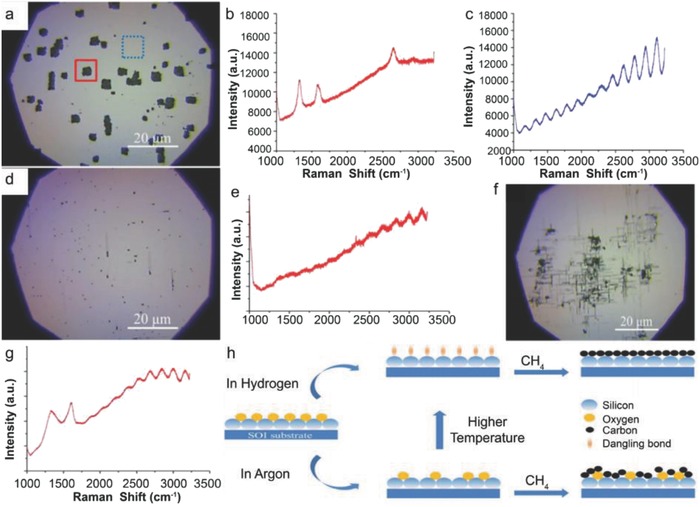
Figure 12.

Graphene growth on SOI at 920 °C in hydrogen atmosphere. a) The optical image. The rectangle black dots (highlighted in solid red box) are covered with graphene, while the white area (highlighted in dashed blue box) is the unreactive SOI surface. b,c) Raman spectra collected in the solid red and dashed blue box, respectively. The three peaks located at 1331, 1589, and 2650 cm−1 are, respectively, associated with the D, G, and G′ modes of graphene. The oscillation curve in (c) is due to optical interference in the sandwich structure of SOI. The peaks at 1000 cm−1 are from silicon. d,f) The optical images of SOI after graphene growth at 870 and 895 °C, respectively. e,g) The Raman spectra detected at the black spot in (d) and (f). h) Schematic of graphene growth mechanismon SOI substrate. Reproduced with permission.15 Copyright 2012, American Institute of Physics.
