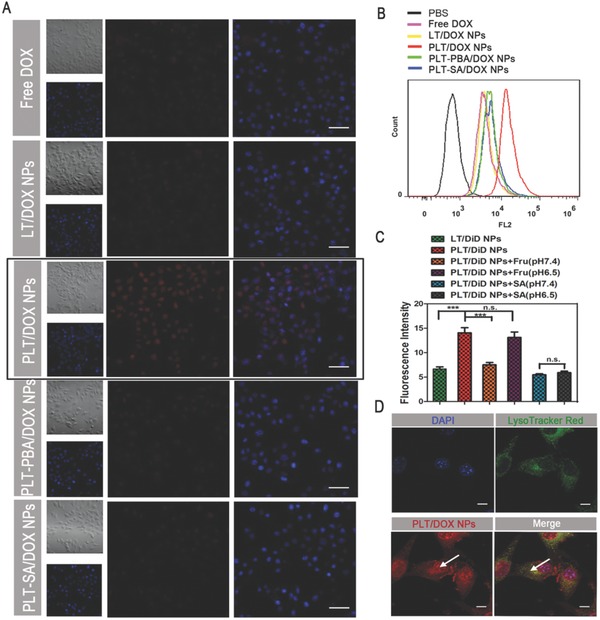
Figure 2.

Cellular uptake of B16F10 cells after incubation with different preparations. A) Confocal laser scanning microscopy (CLSM) images of B16F10 cells after incubation with free DOX, LT/DOX NPs, PLT/DOX NPs, PLT‐BA/DOX NPs, or PLT‐SA/DOX NPs for 2 h. The competitive inhibition assay was performed by preincubating with free PBA or free SA for 1 h and observing the DOX channel (red) and DAPI‐stained nucleus channel (blue). The scale bar represents 100 µm. B) The representative histograms of competitive uptake assay analyzed by flow cytometry (FACS). C) Quantitative cellular uptake of B16F10 cells after incubation with LT/DiD NPs, PLT/DiD NPs, PLT‐Fru/DiD NPs, and PLT‐SA/DiD NPs for 2 h at pH 6.5 and pH 7.4, respectively (means ± SD, n = 3, *** indicates p < 0.001). D) CLSM images of B16F10 cells after incubation with PLT/DOX NPs for 2 h, showing LysoTracker‐stained lysosome channel (green), DOX channel (red), and DAPI‐stained nucleus channel (blue). The arrow in the left indicated the signal of DOX in nucleus and the arrow in the right indicated the colocalization of DOX and lysosome. The scale bar represents 10 µm.
