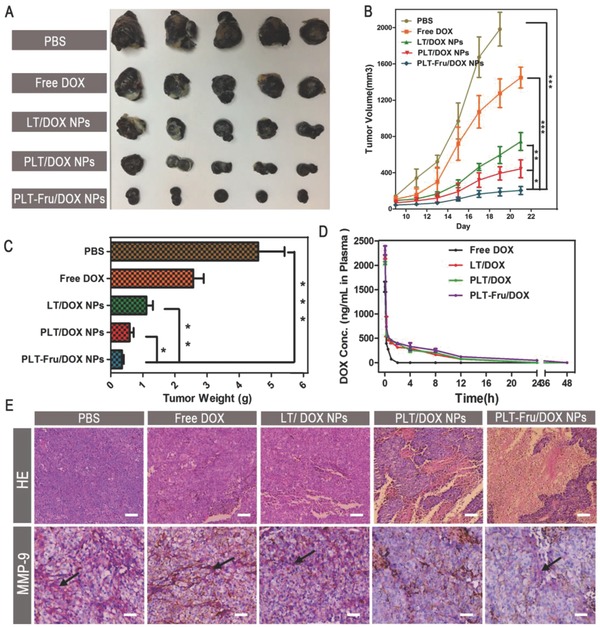
Figure 5.

In vivo B16F10 solid tumor treatment. A) Images of B16F10 tumors harvested from C57BL/6 mice administered PBS, free DOX, LT/DOX NPs, PLT/DOX NPs, or PLT‐Fru/DOX NPs (DOX 3 mg kg−1) by intravenous injection. B) Tumor volume changes in B16F10 tumor‐bearing C57BL/6 mice during the respective therapies (means ± SD, n = 5). * indicates p < 0.05,** indicates p < 0.01, *** indicates p < 0.001. C) Weights of the harvested B16F10 tumors (means ± SD, n = 5). * indicates p < 0.05, ** indicates p < 0.01, *** indicates p < 0.001. D) DOX plasma concentration–time profiles in C57BL/6 mice treated with different DOX formulations (at a dose of 3 mg kg−1 DOX; n = 3). E) Histological analysis of hematoxylin and eosin (H&E) assays and immunohistochemical analysis of MMP‐9 staining for B16F10 tumors. The scale bar indicates 200 µm. The secreted MMP‐9 was stained violet and indicated by black arrows, and the scale bar represents 100 µm.
