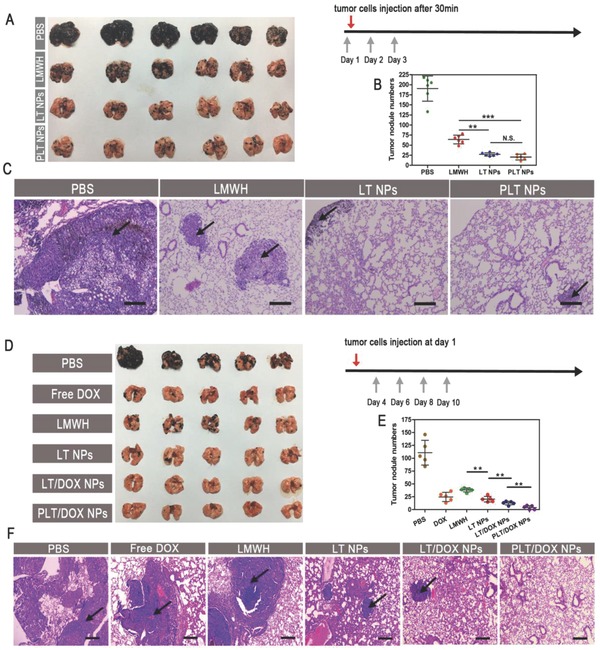
Figure 6.

In vivo antimetastasis treatment. A) Images of lungs, B) the number of B16F10 metastases on the lung surface, and C) histological analysis of H&E assays of lungs from B16F10 metastasis mouse model after pretreatment with PBS, free LMWH, LT NPs, or PLT NPs by intravenous injection (at doses of 60 mg kg−1) (means ± SD, n = 6). ** indicates p < 0.01 and *** indicates p < 0.001. The scale bar indicates 100 µm. D) Images of lungs, E) the number of B16F10 metastases on the lung surface, and F) histological analysis of H&E assays for lungs from B16F10 metastasis mouse model after treatment with PBS, free DOX, free LMWH, LT NPs, LT/DOX NPs, or PLT/DOX NPs by intravenous injection (at equivalent dose of 2.5 mg kg−1 DOX) (means ± SD, n = 5). ** indicates p < 0.01. The scale bar represents 100 µm.
