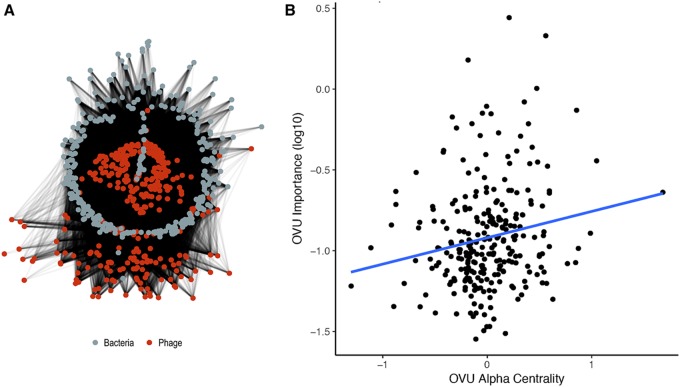
FIG 5.
Community network analysis utilizing predicted interactions between bacterial and phage operational genomic units. (A) Visualization of the community network for our colorectal cancer cohort. (B) Scatter plot illustrating the correlation between importance (mean decrease in accuracy) and the degree of centrality for each OVU. A linear regression line was fitted to illustrate the correlations (blue) found to be statistically significantly and weakly correlated (P value = 0.00409, R = 0.176).

