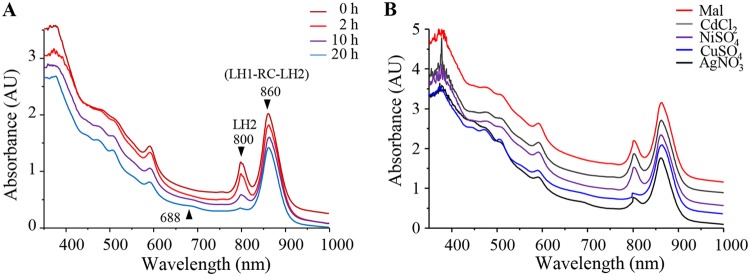
FIG 3.
AgNO3 exposure impact on photosystem in vivo. (A) Spectral analyses of wild type (WT) cells grown overnight by photosynthesis and exposed or not to 1 mM AgNO3 after they reach an OD680 of 2. Spectra (350 to 1,000 nm) were recorded after 2- (light red line), 10- (purple line), or 20-h (blue line) exposure on a double-beam Cary 500 spectrophotometer. (B) Spectral analyses of the WT cells exposed or not to 1 mM CdCl2 (gray line), NiSO4 (purple line), CuSO4 (blue line), or AgNO3 (black line) after they reached an OD680 of 2. Spectra were recorded after 20 h of exposure. Mal (dark red line), untreated cells grown in malate medium.

