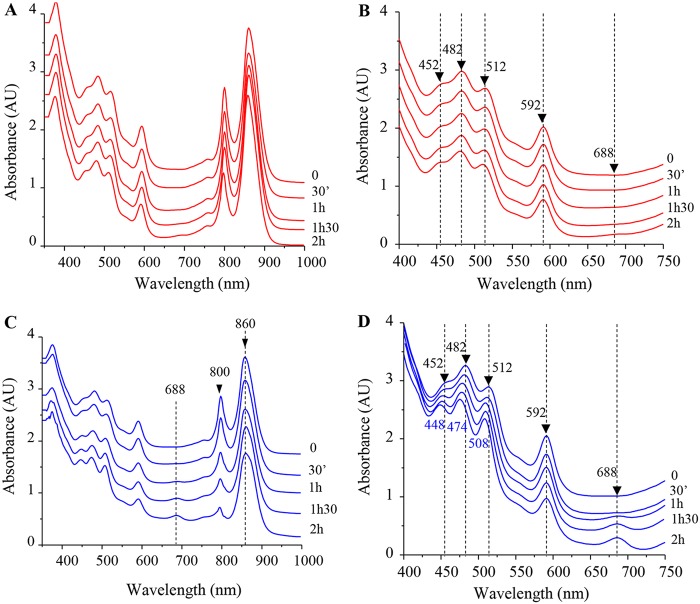
FIG 5.
Effect of CuSO4 on LH2 complexes of isolated membranes. (A) Spectra (350 to 1,000 nm) of untreated membranes were recorded every 30 min. (B) Enlargement of the 400- to 750-nm spectrum absorbance region of untreated membranes. (C) Enriched membrane fractions were mixed with CuSO4 at 2 mM final concentration; 350- to 1,000-nm spectra were then recorded every 30 min. (D) Enlargement of the 400- to 750-nm spectrum absorbance region, highlighting the shift in the carotenoids bands and the increase in the 688-nm band in the CuSO4-treated membranes.

