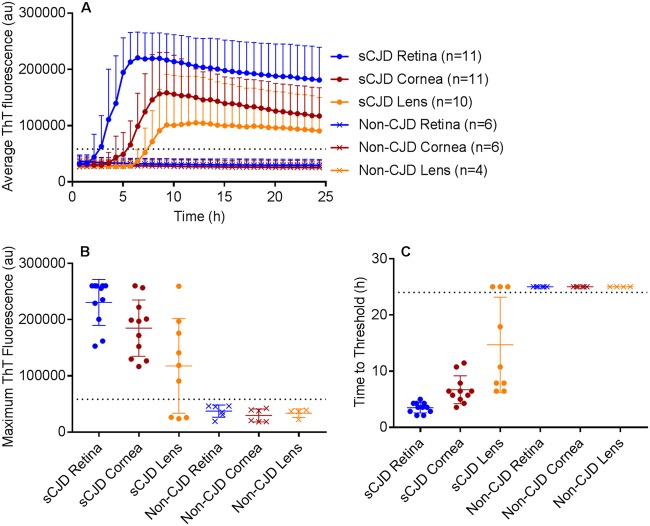
FIG 2.
RT-QuIC of retina, cornea, and lens from sCJD and non-sCJD patients. (A) The average prion seeding amplification kinetics are shown for retina (blue), cornea (red), and lens (orange) from sCJD (circles) and non-CJD (X’s) patients. The dotted line indicates the ThT fluorescence threshold for a positive result (see Materials and Methods). (B) The maximum ThT fluorescence reached within 24 hours is shown. The thin lines represent mean and standard deviation, whereas the dotted line indicates the ThT fluorescence threshold for a positive result. (C) The time to reach the threshold for positivity is shown for each sample. The dotted line indicates the end of the 24-hour experiment. If a sample did not reach the threshold within 24 h, it was marked as 25 h to indicate a negative result. n = 4 (lens) or 6 (retina, cornea) non-CJD control cases were analyzed.

