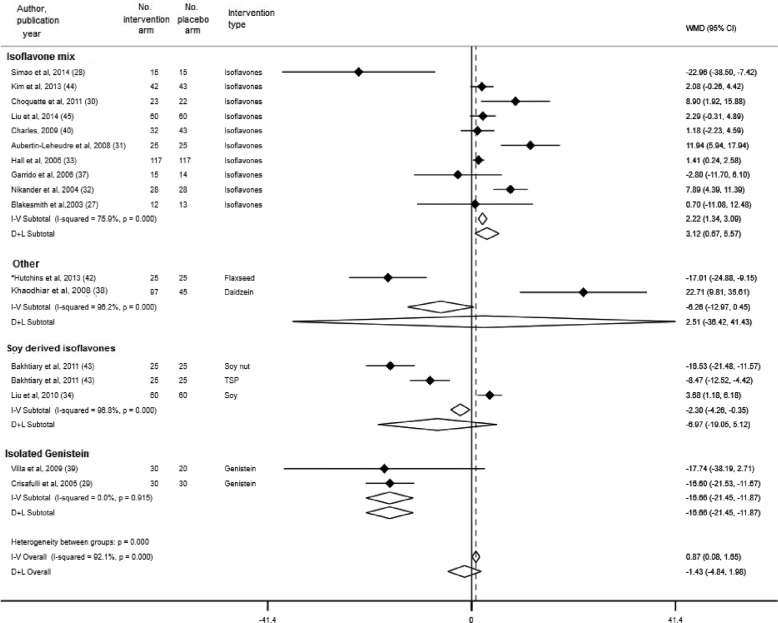
FIGURE 3.
Subgroup analysis by type of phytoestrogen and changes in serum insulin. Error bars indicate 95% CIs. The solid vertical line represents no effect; the dotted line drawn through the diamond represents the summary measure with its CIs (lateral tips of diamond). Heterogeneity assessment: I2, P values are derived from Q-statistics; in subgroup analysis we used multiple estimations from the same trial (for different phytoestrogen type), which may result in slight variations in overall estimates in this figure compared with Supplemental Figure 2. *No significant relations between sex, body weight, BMI, or percentage fat mass and changes, or lack of changes, in glucose, insulin, HOMA-IR, and inflammatory or anti-inflammatory biomarkers were found; therefore, all further analyses were conducted based on the intervention. D+L, random-effects model; I-V, fixed-effects model; TSP, texturized soy protein; WMD, weighted mean difference (the mean difference refers to mean difference of changes between treatment groups).

