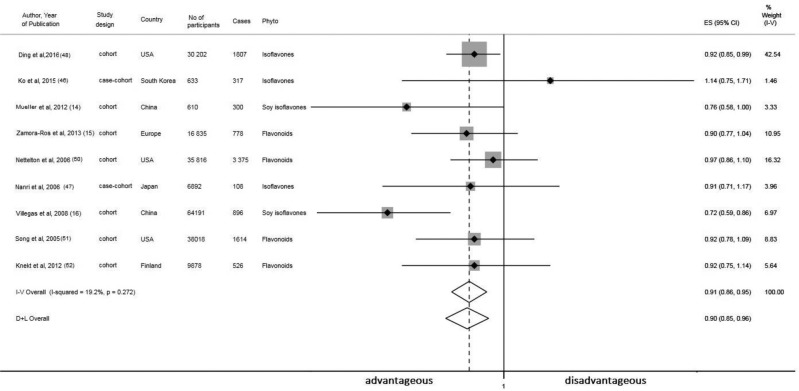
FIGURE 5.
Meta-analysis of prospective population-based studies on the associations between dietary phytoestrogen intake and risk of type 2 diabetes in women. Sizes of data markers are proportional to the inverse of the variance of the OR. The solid vertical line represents no effect; the dotted line drawn through the diamond represents the summary measure with its CIs (lateral tips of diamond). Heterogeneity assessment: I2, P values are derived from Q-statistics. D+L, random-effects model; ES, effect size; I-V, fixed-effects model; Phyto, phytoestrogen.

