
Figure 1.
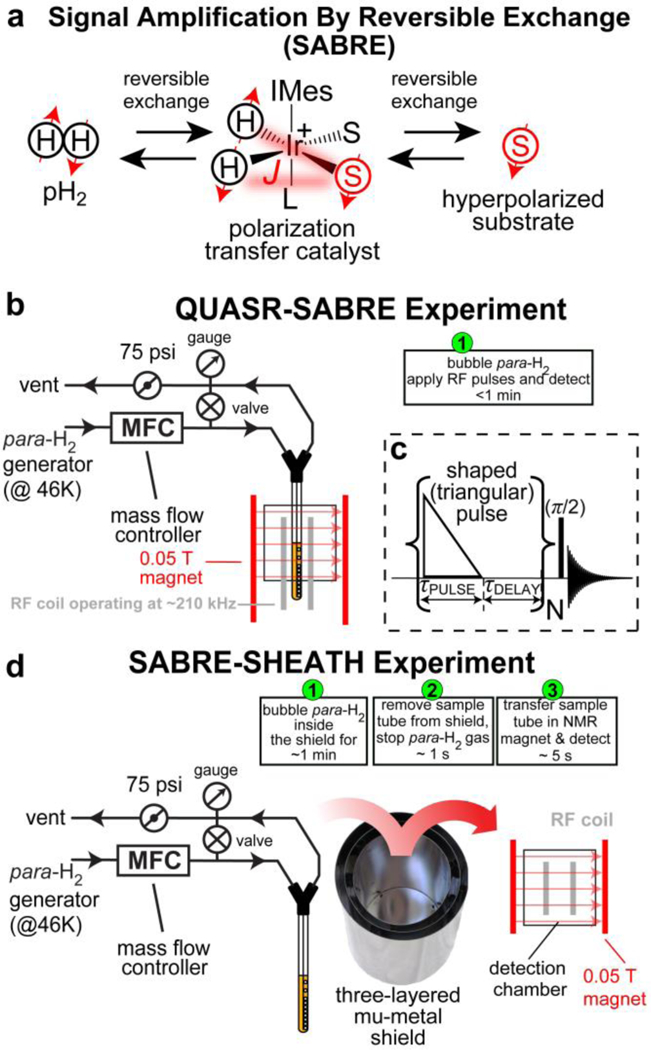
a) The diagram of molecular exchange with p-H2 in SABRE hyperpolarization. b) the experimental setup for QUASR-SABRE, c) the RF pulse sequence for QUASR-SABRE, d) corresponding experimental setup for SABRE-SHEATH experiment.
Official websites use .gov
A
.gov website belongs to an official
government organization in the United States.
Secure .gov websites use HTTPS
A lock (
) or https:// means you've safely
connected to the .gov website. Share sensitive
information only on official, secure websites.
a) The diagram of molecular exchange with p-H2 in SABRE hyperpolarization. b) the experimental setup for QUASR-SABRE, c) the RF pulse sequence for QUASR-SABRE, d) corresponding experimental setup for SABRE-SHEATH experiment.