
Figure 3.
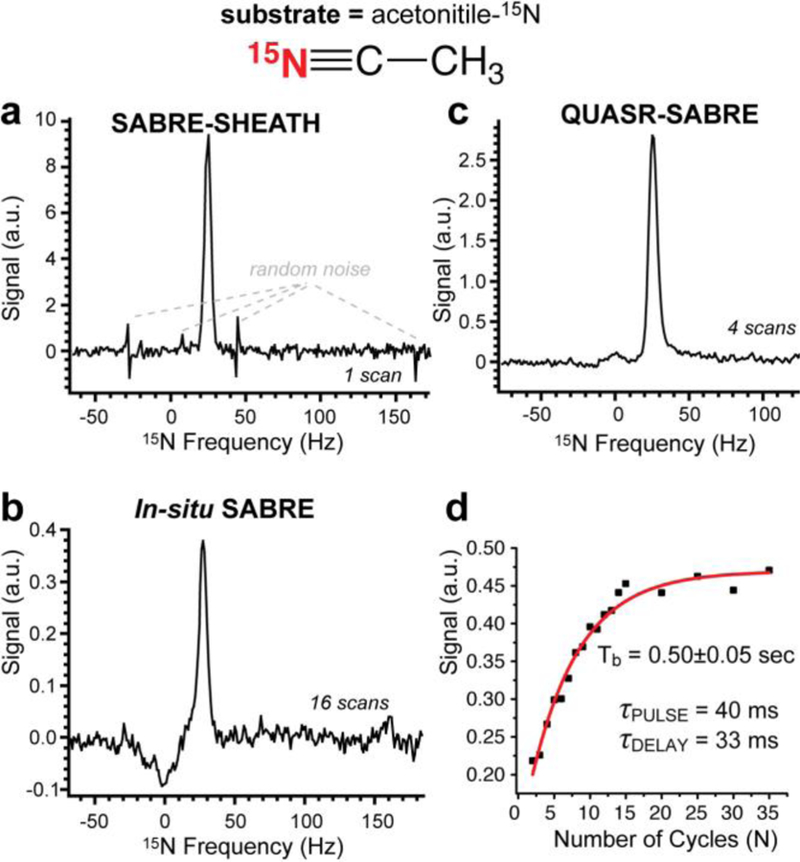
acetonitrile-15N data. The other experimental conditions were as follows: 40 mM acetonitrile-15N, 1 or 2 mM catalyst in CD3OD. Note the width of the signal in displays a and c is nearly the same as opposed to pyridine-15N case. a) the 15N spectrum obtained after performing SABRE-SHEATH; b) The 15N spectrum recorded using 90-degree excitation pulse when bubbling p-H2 in situ of the 0.05 T magnet; c) the 15N spectrum obtained after performing QUASR-SABRE; d) the build-up of 15N QUASR-SABRE signal as a function of the number of pumping cycles; Note the individual spectra employed for figures in display d were auto-phased, and the data is presented in the magnitude mode.