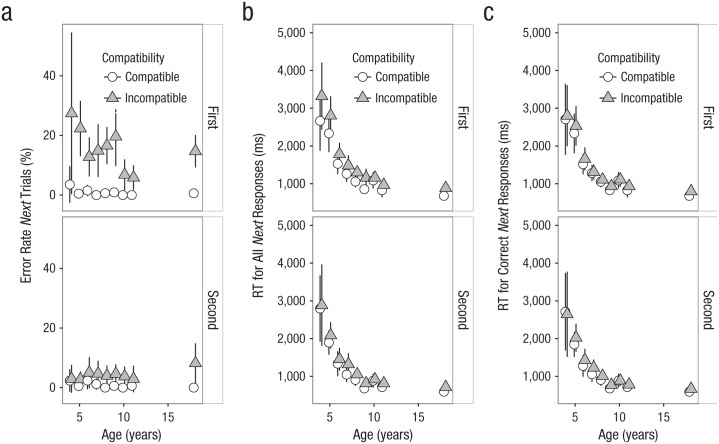
Fig. 3.
Overview of the next data for the first half (top row) and second half (bottom row) of the experiment (see Method section for a discussion of the different dependent variables). The graphs show mean (a) error rate on next trials, (b) response time (RT) for all responses on next trials, and (c) RT for correct responses only on next trials; results are shown as a function of participants’ age and trial type. Error bars reflect 95% confidence intervals.

